Account-Level Performance Insights
The account-level performance insights page gives you an overview of the health and performance for all sites on a single account.
Currently the account-level performance insights page is only available for Core and Enterprise plans.
Note
The account-level performance insights page is currently in a beta release and will be slowly rolled out to accounts with Core and Enterprise plans throughout September 2025.
Access the Account-Level Performance Insights Page
To access the account-level performance page go to Insights > Performance in the main left sidebar.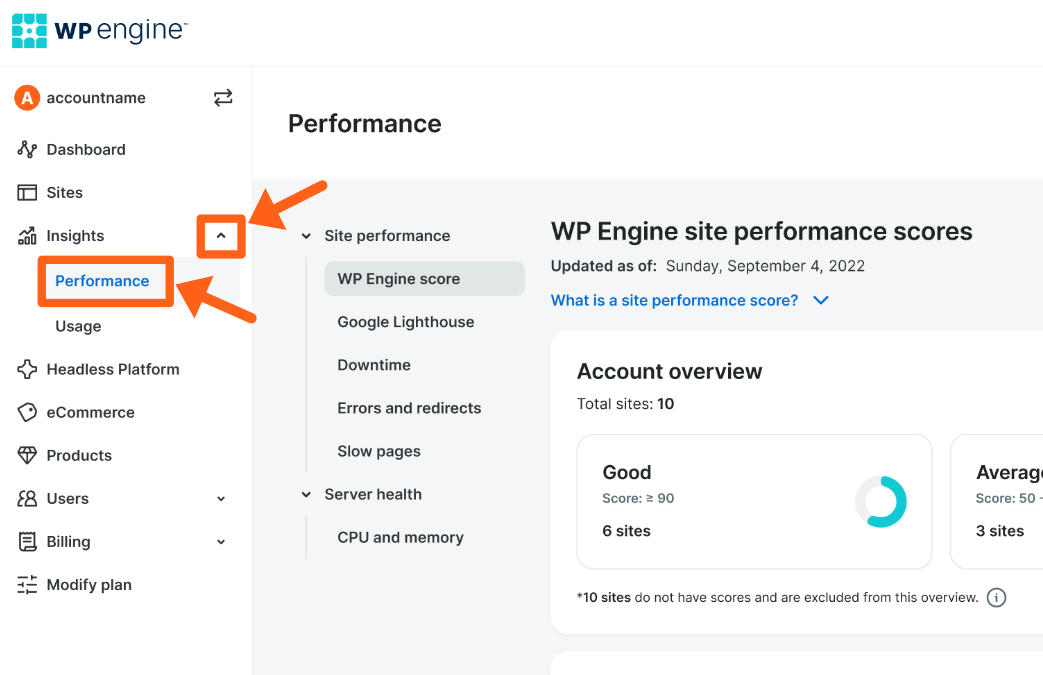
WP Engine Score
The WP Engine site performance score is a metric that assigns an overall health score to your website’s performance based on metrics that we think are key in delivering a great experience to your visitors. Read more about the WP Engine site performance score here.
WP Engine Score Overview Graphs
In the following screenshot of the overview graphs, you can see an example of an account with 5 sites that have a Good rating, 0 sites that have Average or Poor ratings, and 13 sites that don’t have enough data collected yet to have a performance score.
WP Engine Scores by Environment
The graph that shows WP Engine scores by environment lets you sort the environments by their WP Engine score and also shows other relevant sortable columns for comparison.
Sorting by the additional columns can help give you insight into the score for environments relative to each metric. To learn more about the additional metrics, you can review the sections for each in our site-level performance insights article:
Google Lighthouse
Google Lighthouse scores show how well a page will rank for 4 of the key metrics that contribute to the page’s Google page rank score. The key metrics are:
Google Lighthouse Overview Graphs
The overview graphs show how many sites are in each grade range across the 4 key metrics, based on our most recent Google Lighthouse report for each environment. The scores are run for the home page of a site.
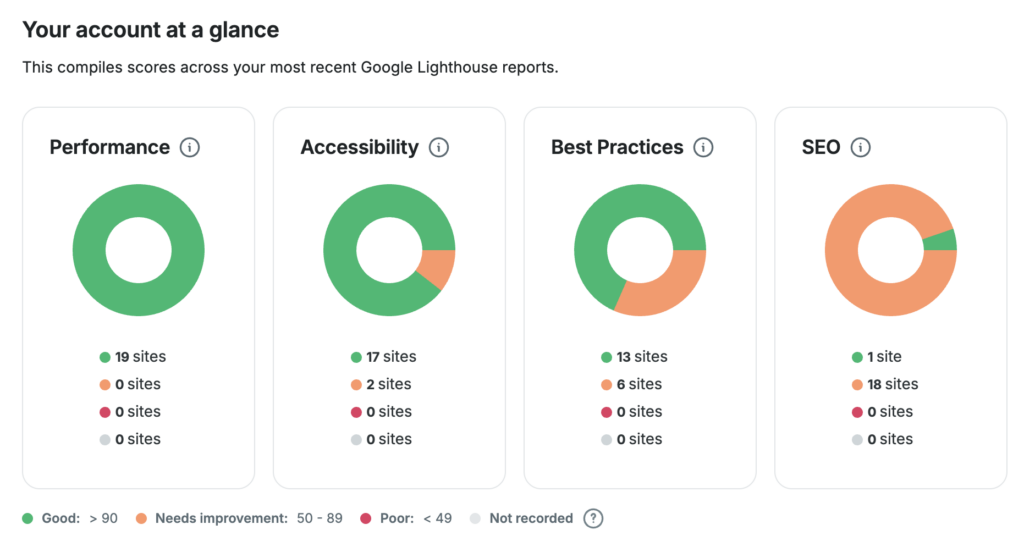
The grade ranges are:
- 90 and above: Good
- 50 to 89: Needs improvement
- Below 50: Poor
- Not recorded: Scores are not recorded for sites that do not have a custom primary domain name assigned to the site.
Google Lighthouse Scores by Environment
The table for scores by environment shows the score for each of the 4 Lighthouse metrics, the date of the last Lighthouse report, and the active status of our Page Speed Boost product for the environment.
The Lighthouse metrics columns are all sortable to allow you to compare environments with the best and worst scores for each category. You’ll see an arrow button for sorting when you hover over each column name as shown in the screenshot above.
Downtime
The downtime report is powered by our Site Monitoring product. Environments that do not have a Site Monitoring license will not have data to show until a license has been added and enough data has been collected. You may not see this page in the initial Beta release but it will be available soon after.
Note
Downtime references on this page do not refer to server outages. They refer to error codes generated on your site. Information about server outages can be found on our status page.
Longest Outage Duration
This table shows environments with the longest outage durations from error codes detected on the site.

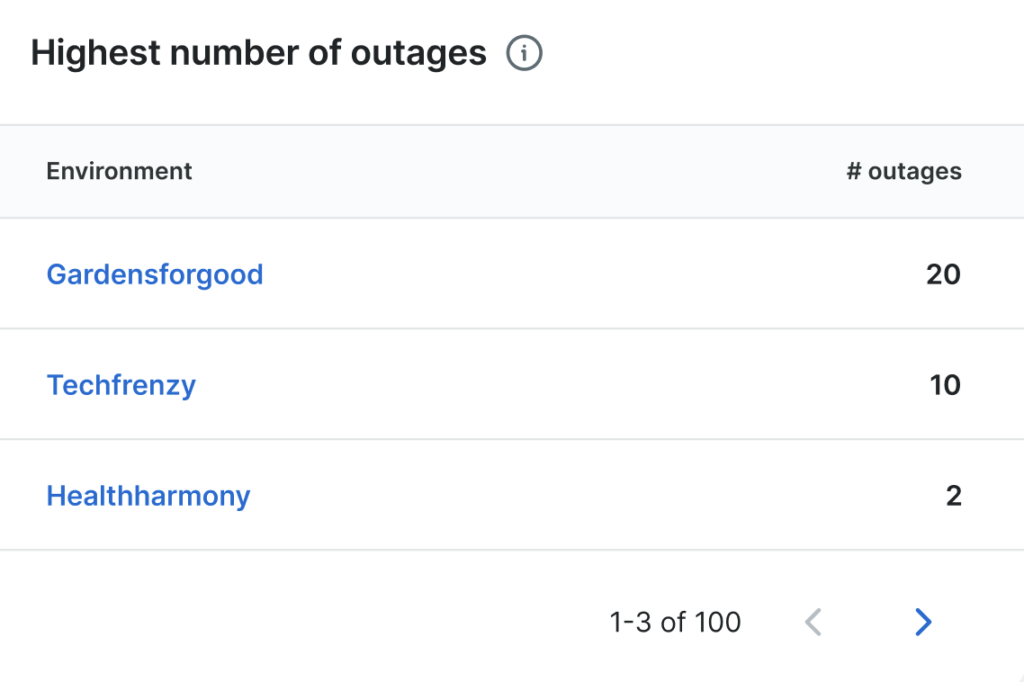
Highest Number of Outages
This table shows environments with the highest number of outage periods. 1 outage period would be from the time that an error is detected, to the time that a successful (200) response code is detected again.
Number of Outages Vs. Total Downtime
This graph shows a visual comparison of the aggregate data from the previous 2 tables. The graph shows combined numbers for all environments, for the specific day or hour depending on the time frame selected.
Errors and Redirects
The Errors and redirects page gives an overview of the response codes that visitors to your websites receive. There are 4 main categories of response codes that each have their own number ranges. The ranges start with 200, 300, 400, and 500. These 4 categories are also referred to as 2xx, 3xx, 4xx, and 5xx representing their number ranges.
- 2xx – Response codes in the 200 range are success responses. This means that the server responded successfully with the content for the web page. Your visitors will not see any indication of the response code in the browser since it’s a successful response. They will see the normal web page.
- 3xx – Response codes in the 300 range simply indicate a redirect. This means that the URL was redirected to a new URL. The URL that it was directed to will return its own separate response code indicating success or failure. Some examples of these codes are:
- 301 – Permanent redirect.
- 302 – Temporary redirect.
- 4xx – Response codes in the 400 range indicate a permissions issue. This means that either WP Engine blocked the request for some reason, or that you have added an access rule that blocked the request. Some examples or 4xx errors are:
- 401 – A 401 response code indicates that some form of basic auth password protection is in place for a web page and a valid username and password were not passed along with the request. Our password protection feature that you can turn on in the User Portal is one example. If the correct username and password are given the response will be a successful 200 response, and if not it will be a 401 error response.
- 403 – A 403 error indicates permission denied. This means that a rule was added that denied the visitor access to the web page. Our access rules that you can add in the Web Rules page of the User Portal for an environment, are one example of this. Requests can be denied based on characteristics of the request itself, like query strings added to the end of the URL, or by the visitor. Visitors can be blocked by characteristics like their geographic region, or their User-Agent (web browser, etc).
- 5xx – Response codes in the 500 range indicate a server error, either from invalid code on a site, or an issue with the server itself. Some examples of 5xx errors are:
- 500 – Internal server error. A 500 error will be returned when there is an error in the php code that you have added for your site in some way. These can arise due to reasons such as plugin, theme, and WordPress Core updates, or from custom code being added to a site. Some updates can also have valid code while introducing an incompatibility with code in another place.
- 502 – Bad gateway error.
- 504 – A 504 error indicates that the queue for requests is full. Requests wait in line to be processed by the server, and if there are too many requests waiting to be processed at a time, then the request will be canceled and show a 504 response code. This can be caused by a very high number of requests or by requests that are taking too long to process.
Errors and Redirects Overview Graphs
The Breakdown and Trends overview graphs show the number of each error category for the account. It will show aggregate numbers for all environments by the day or the hour, depending on which time range you select (30 days or 24hr). The breakdown circle graph will show totals for the time range selected.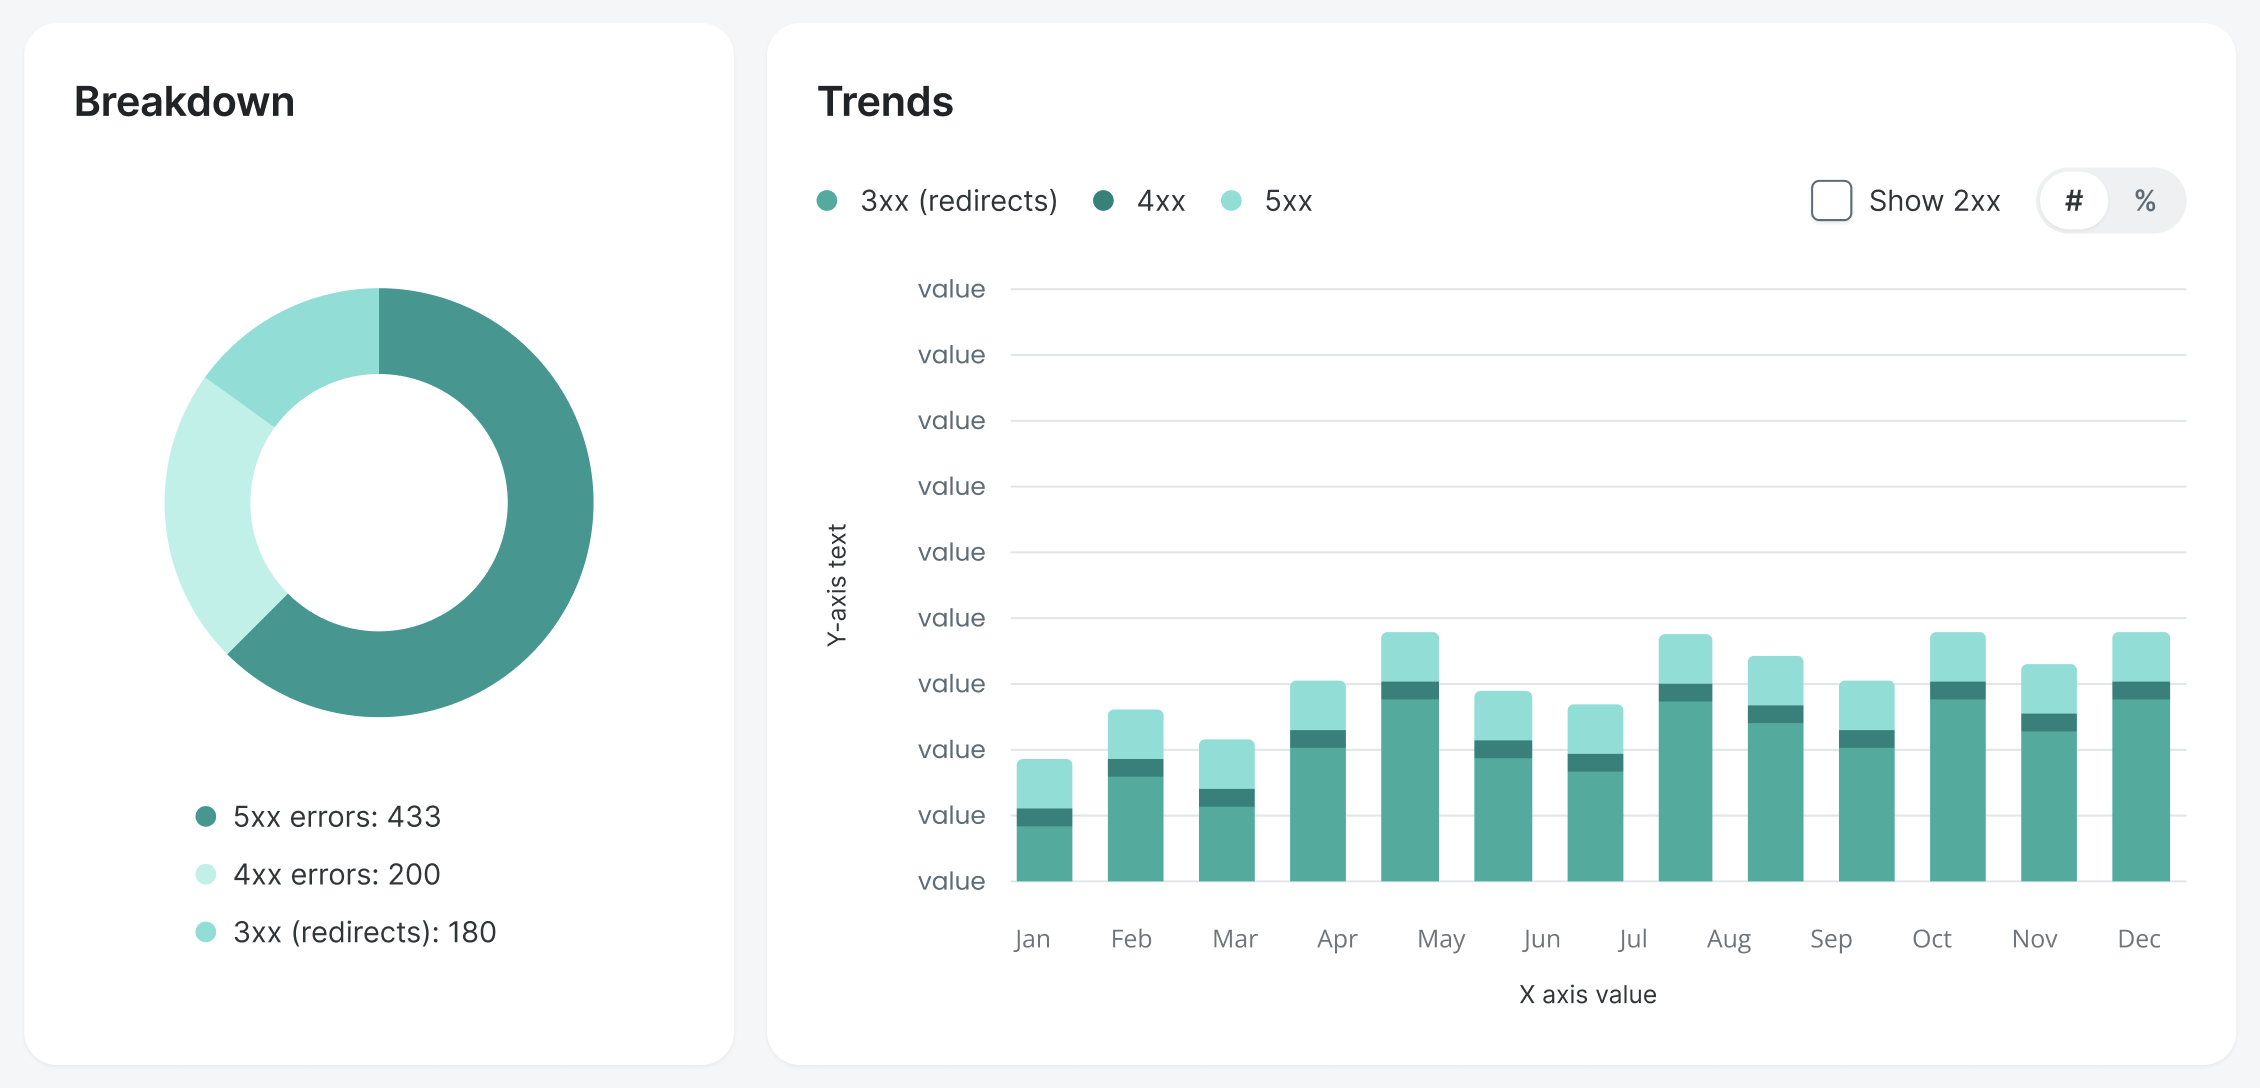
Errors by Environment
The errors by environment table shows sortable columns for each of the 3 error response code categories, plus total errors, and the error rate for the environment. The error rate is the percentage of requests that returned an error response code during the time range selected.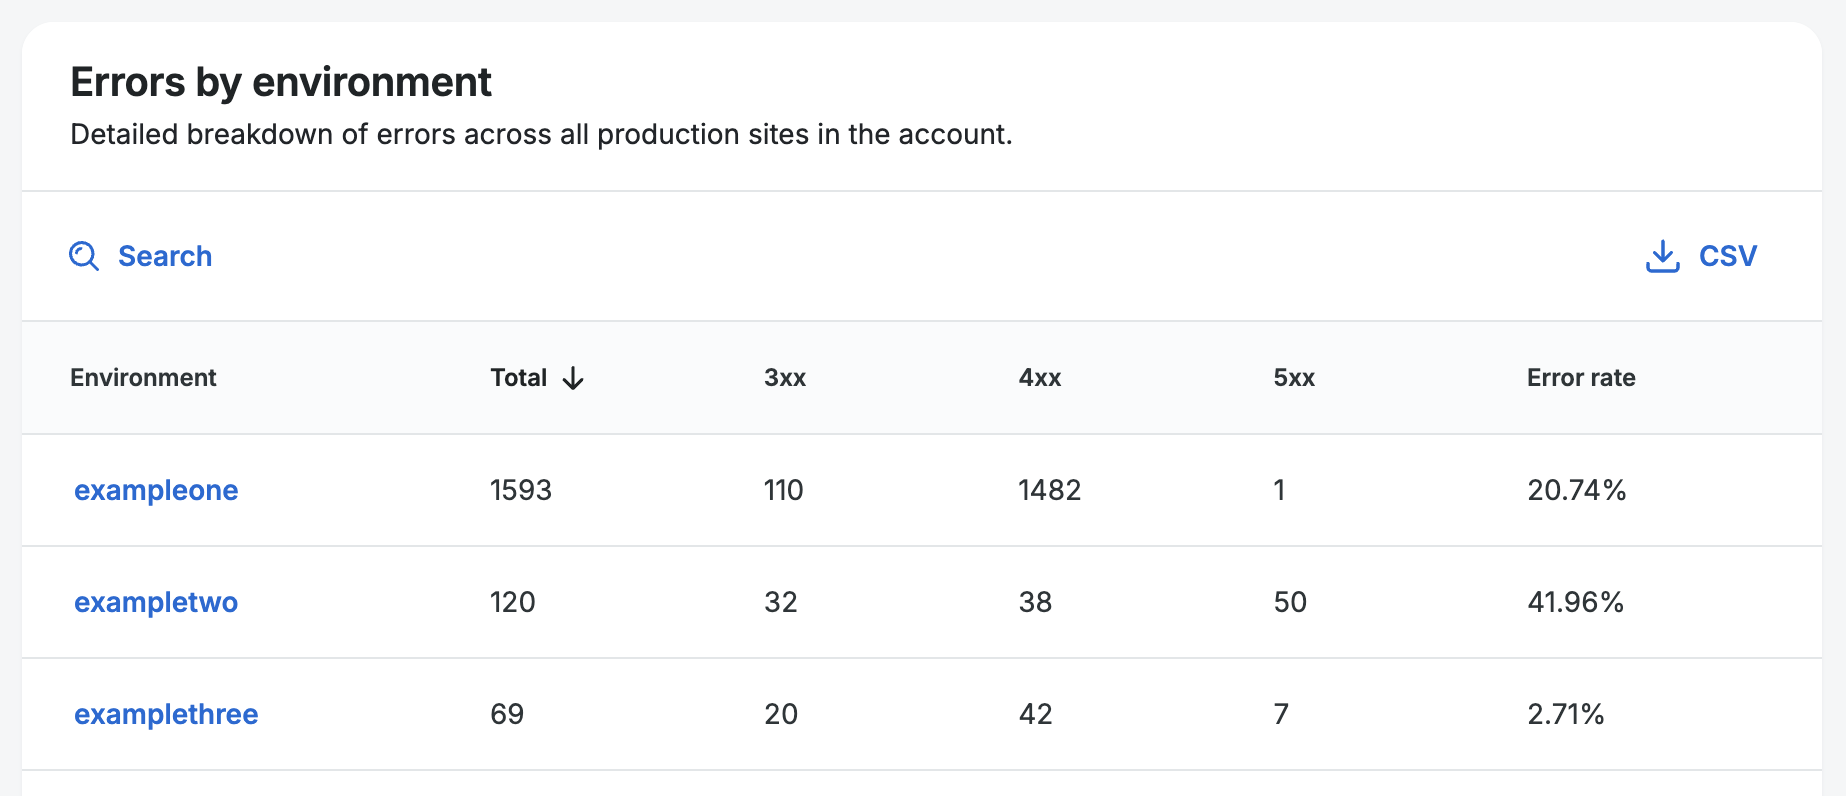
Slow Pages
The slow pages table shows your top 50 slowest pages across your account.
The following columns are included to provide additional information about each slow page:
- Page – This is the URL path that comes after the domain name.
- Environment – This gives a link to the environment that the page belongs to.
- Load time – This is the time that it took the page to load in milliseconds. Each 1000 milliseconds equals 1 second.
Example: 3000ms = 3 seconds.
Example: 300ms = 0.3 seconds. - Error rate – This is the percentage of page requests for the page that responded with an error code. Ideally this number should be low.
- Cache hit (cache hit ratio) – This is the percentage of page requests for the page that were served from cache on the WP Engine server. Ideally this number should be very high for pages that have static content. Pages with dynamic content may need a lower percentage of pages served from cache.
- Page requests – The total number of page requests for the page from the selected time range.
PHP Resources
The graphs for PHP resources have an option to select from 2 different time ranges. The time ranges are Last 30 days and Last 24 hours.

The Last 30 days view shows the following 4 tables:
- CPU: Highest average utilization – This shows the average PHP CPU usage for the hour with the highest average for each day.
- CPU: Average of hourly max – This shows the average of the highest spike in PHP CPU usage from each hour of the day.
- Memory: Highest average utilization – This shows the value for the hour with the highest average PHP memory usage of each day.
- Memory: Average of hourly max – This shows the average of the highest spike in PHP memory usage from each hour of the day.
The Last 24h view shows the following 4 tables:
- CPU: Hourly max – This shows the highest spikes in PHP CPU usage for each hour.
- CPU: Hourly average – This shows the average PHP CPU usage for each hour.
- Memory: Hourly max – This shows the highest spikes in PHP memory usage for each hour.
- Memory: Hourly average – This shows the average PHP memory usage for each hour.
MySQL Resources
The graphs for MySQL resources have an option to select from 2 different time ranges. The time ranges are Last 30 days and Last 24 hours.
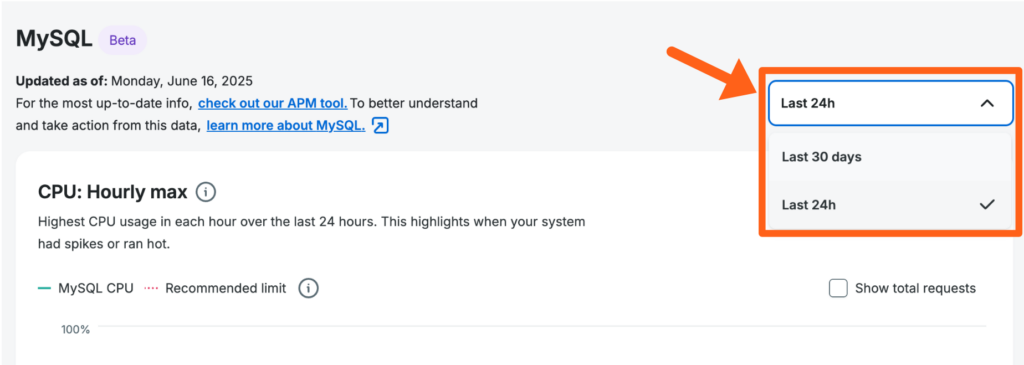
The Last 30 days view shows the following 2 tables:
- CPU: Highest average utilization – This shows the average MySQL CPU usage for the hour with the highest average for each day.
- CPU: Average of hourly max – This shows the average of the highest spike in MySQL CPU usage from each hour of the day.
The Last 24h view shows the following 2 tables:
- CPU: Hourly max – This shows the highest spikes in MySQL CPU usage for each hour.
- CPU: Hourly average – This shows the average MySQL CPU usage for each hour.
Next steps: Review Site-Level Performance Insights
