Generate a HAR File for Troubleshooting
A HAR file is an Http Archive file. Downloading an http archive file for a web page lets you save the current state of the metadata for your web page. If you are having an issue with one of your web pages, then sharing this file with our support team can help to give them information about how to replicate the issue. It is common for our support team to request this for issues that are hard to replicate and require investigation through a support ticket.
How to Generate a HAR File
Instructions for downloading a HAR file will be different for each browser. We’ve included detailed instructions for some of the most used web browsers. Find the section below corresponding to your current web browser, or search online if you are using a browser that is not included.
It’s helpful to view your web page in an Incognito (Private) browser window when downloading a HAR file, if you are able to replicate your issue in an incognito window. This ensures that the state of the page is more easily replicable for others since it will exclude states that can be specific to you, like settings from cookies, or browser extensions, etc.
Google Chrome
To generate a HAR file in the Google Chrome web browser:
- Go to the web page that you want to record, and right click anywhere on the page. Then select the Inspect option from the context menu.
Note: many factors change the menu items listed in the context menu, but you should still find the Inspect option somewhere in the list.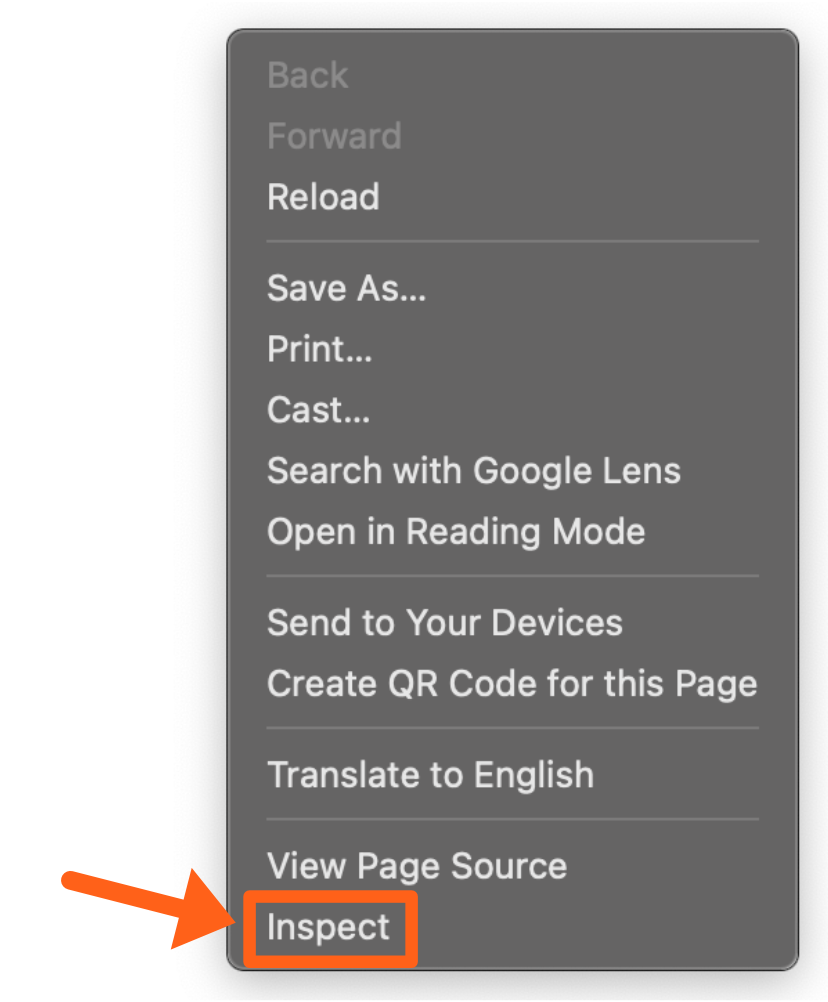
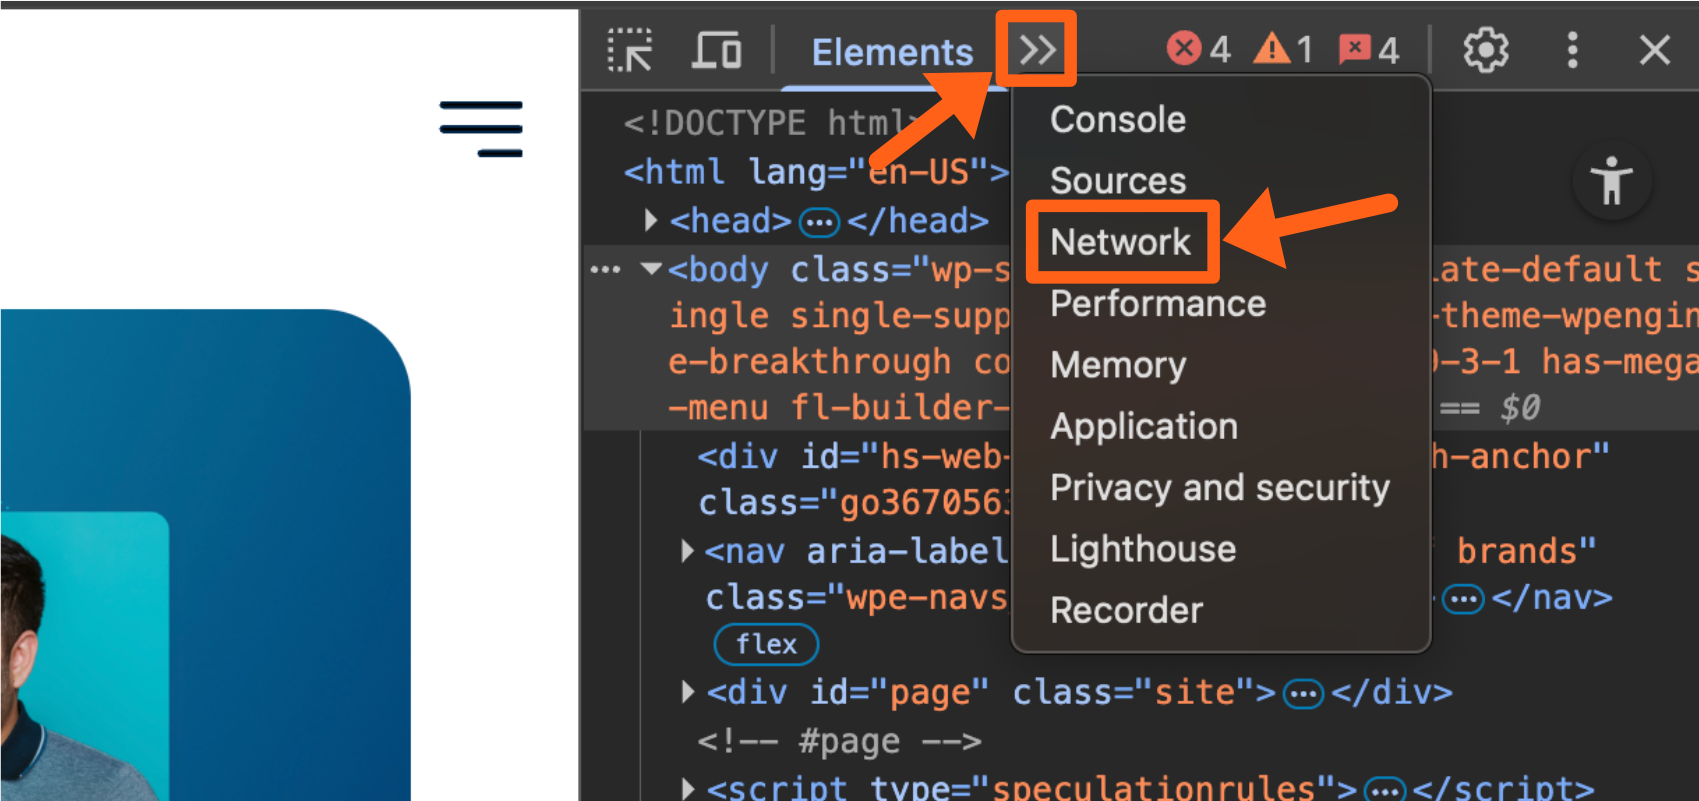
- Click on the Network tab at the top of the developer tools panel. You may have to click on the button with 2 right arrows, to see the list of tabs, if you have the developer panel condensed to a smaller width.
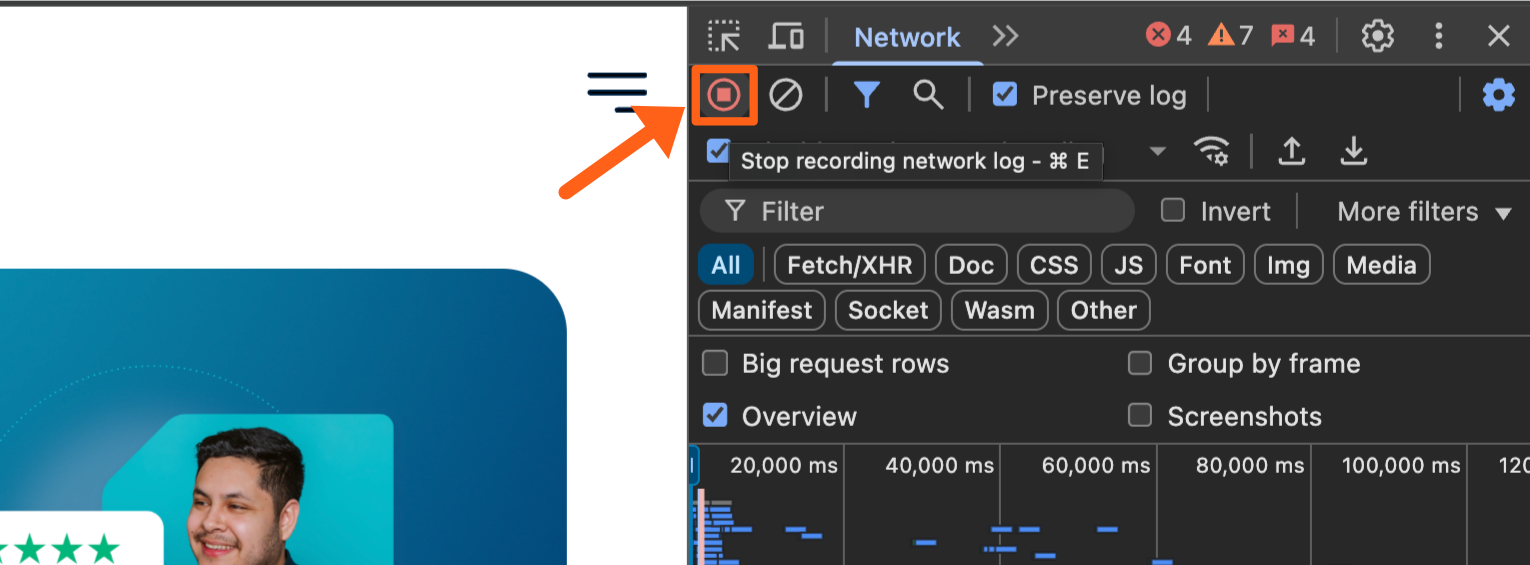
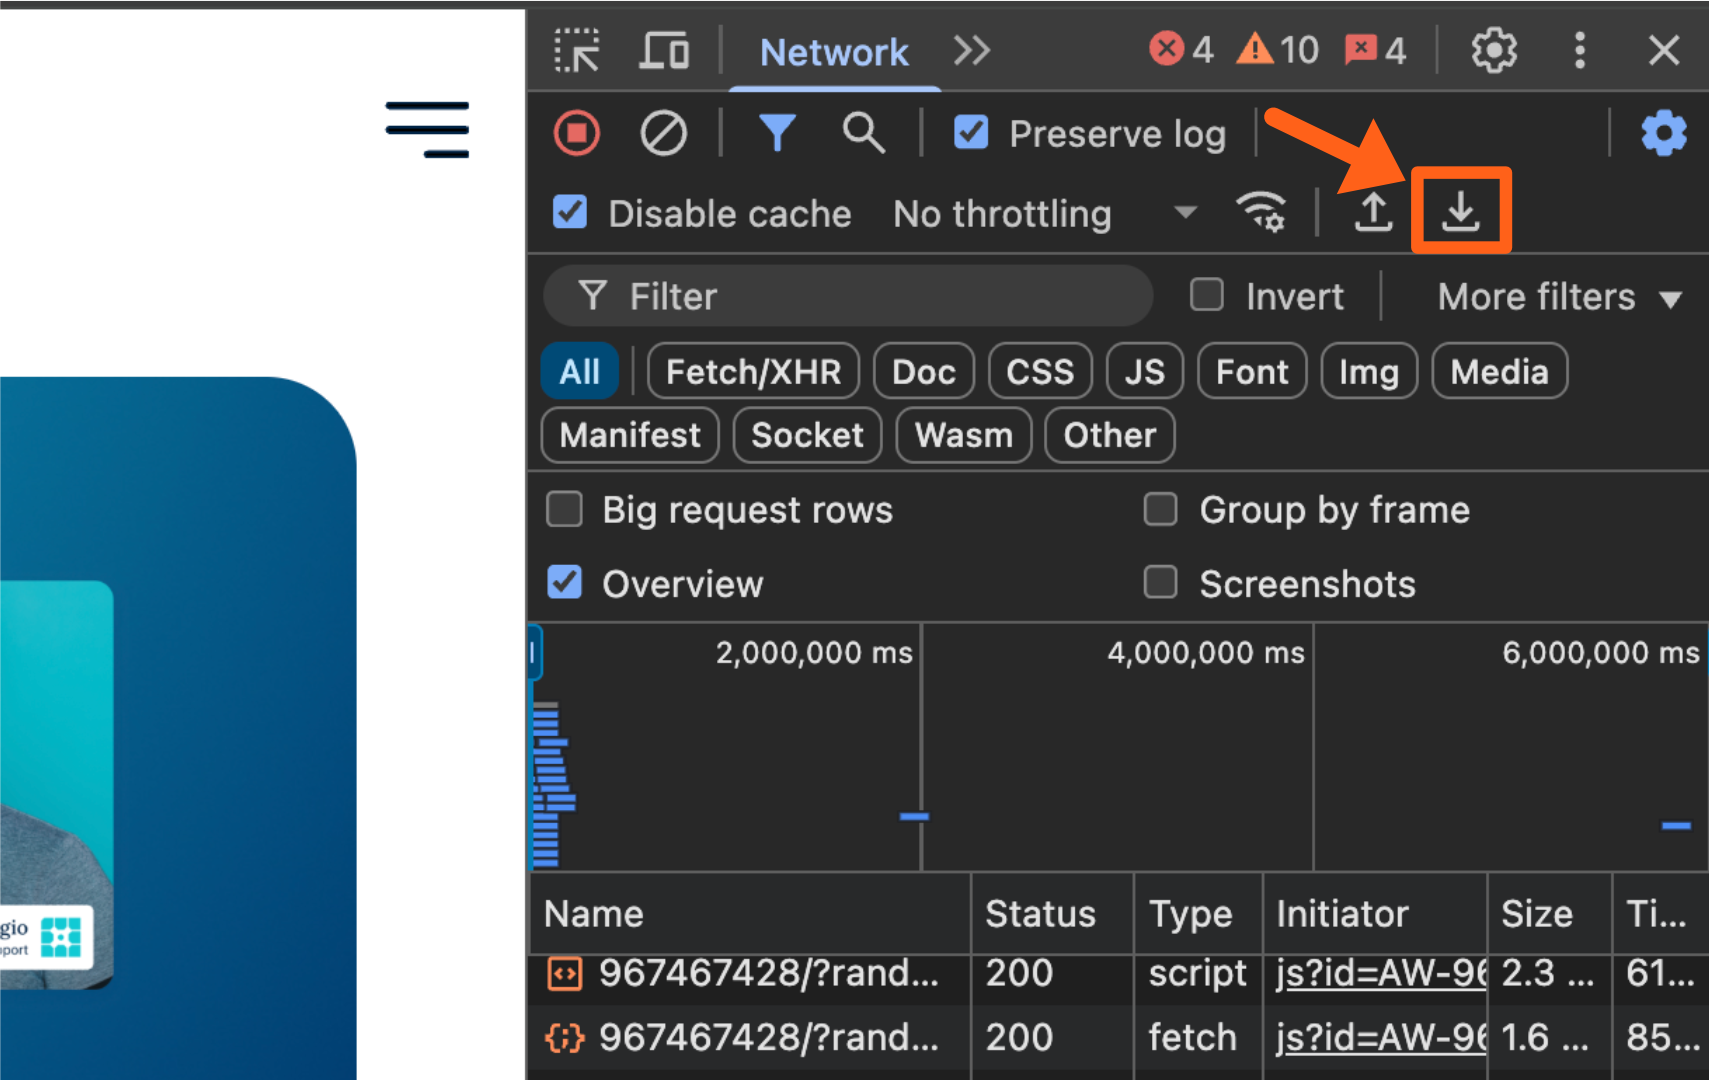
- Locate the record button in the top left of the Network tab and make that sure that it is on. This will record network requests for the web page. When it is on you will see a message when you hover over it, that says “Stop recording network log”. It is on in the below screenshot. Also make sure that the Preserve log box is checked as shown below.
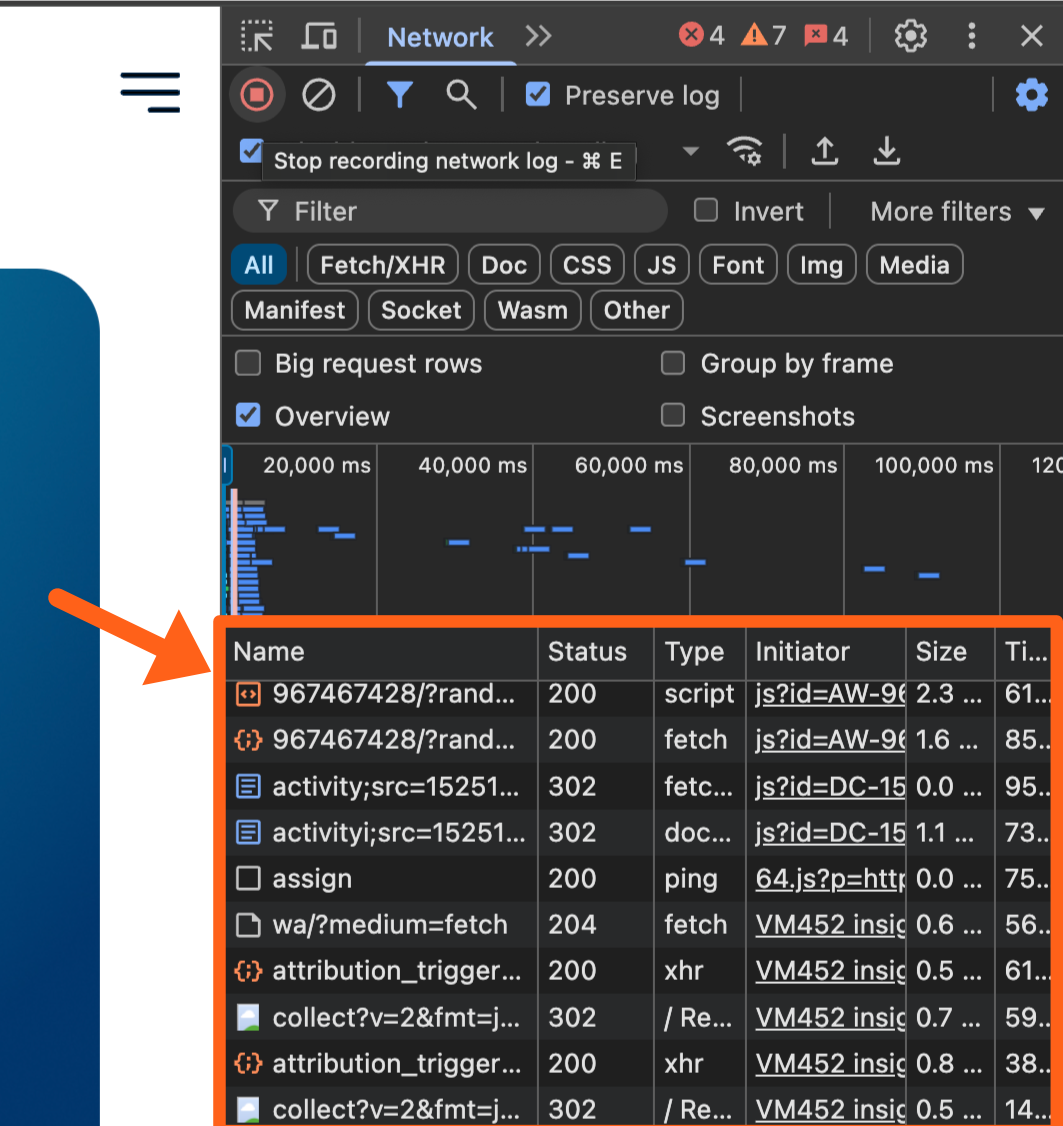
- Once the record button is on, refresh the web page. If the record option has been correctly enabled, you will see a list of network requests for the web page as shown below.
- Recreate the issue that you are troubleshooting on the web page.
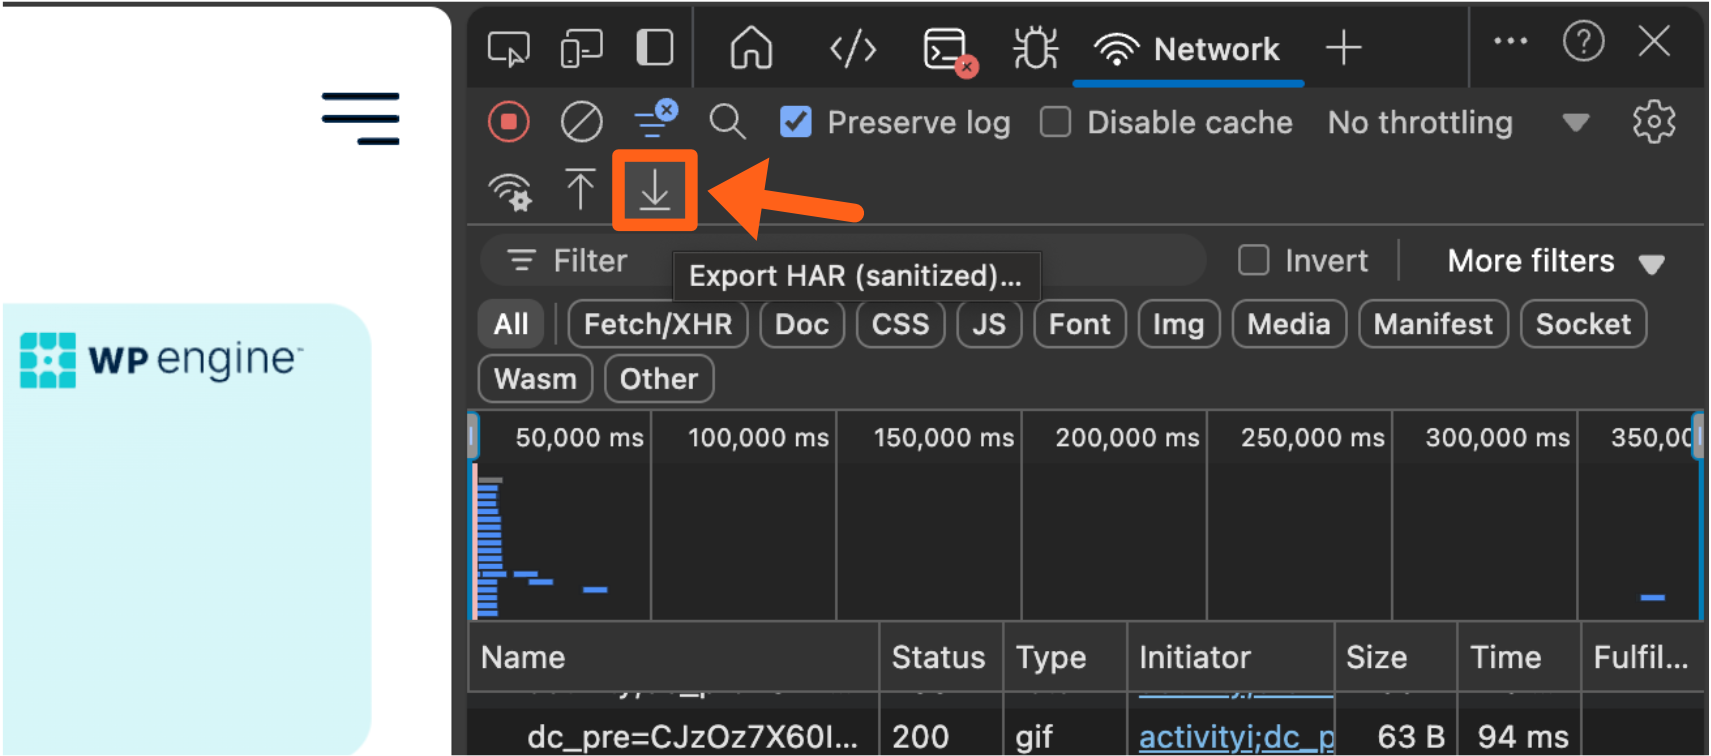
- Once your issue is present on the web page, click the Export HAR button, which is a downward arrow icon as shown below.
- After clicking the export button, you will have a file downloaded to your computer with a file extension of
.harthat you can provide to our support team.
Firefox
To generate a HAR file in the Firefox web browser:
- Go to the web page that you want to record, and right click anywhere on the page. Then select the Inspect option from the context menu.
Note: many factors change the menu items listed in the context menu, but you should still find the Inspect option somewhere in the list.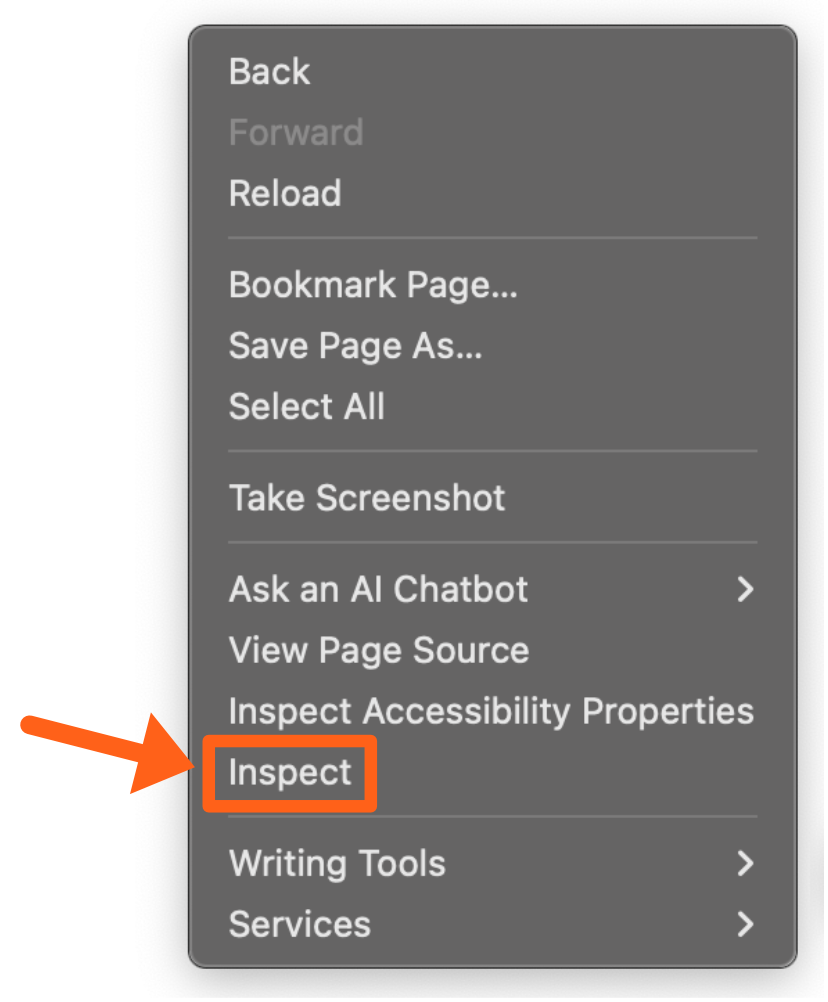
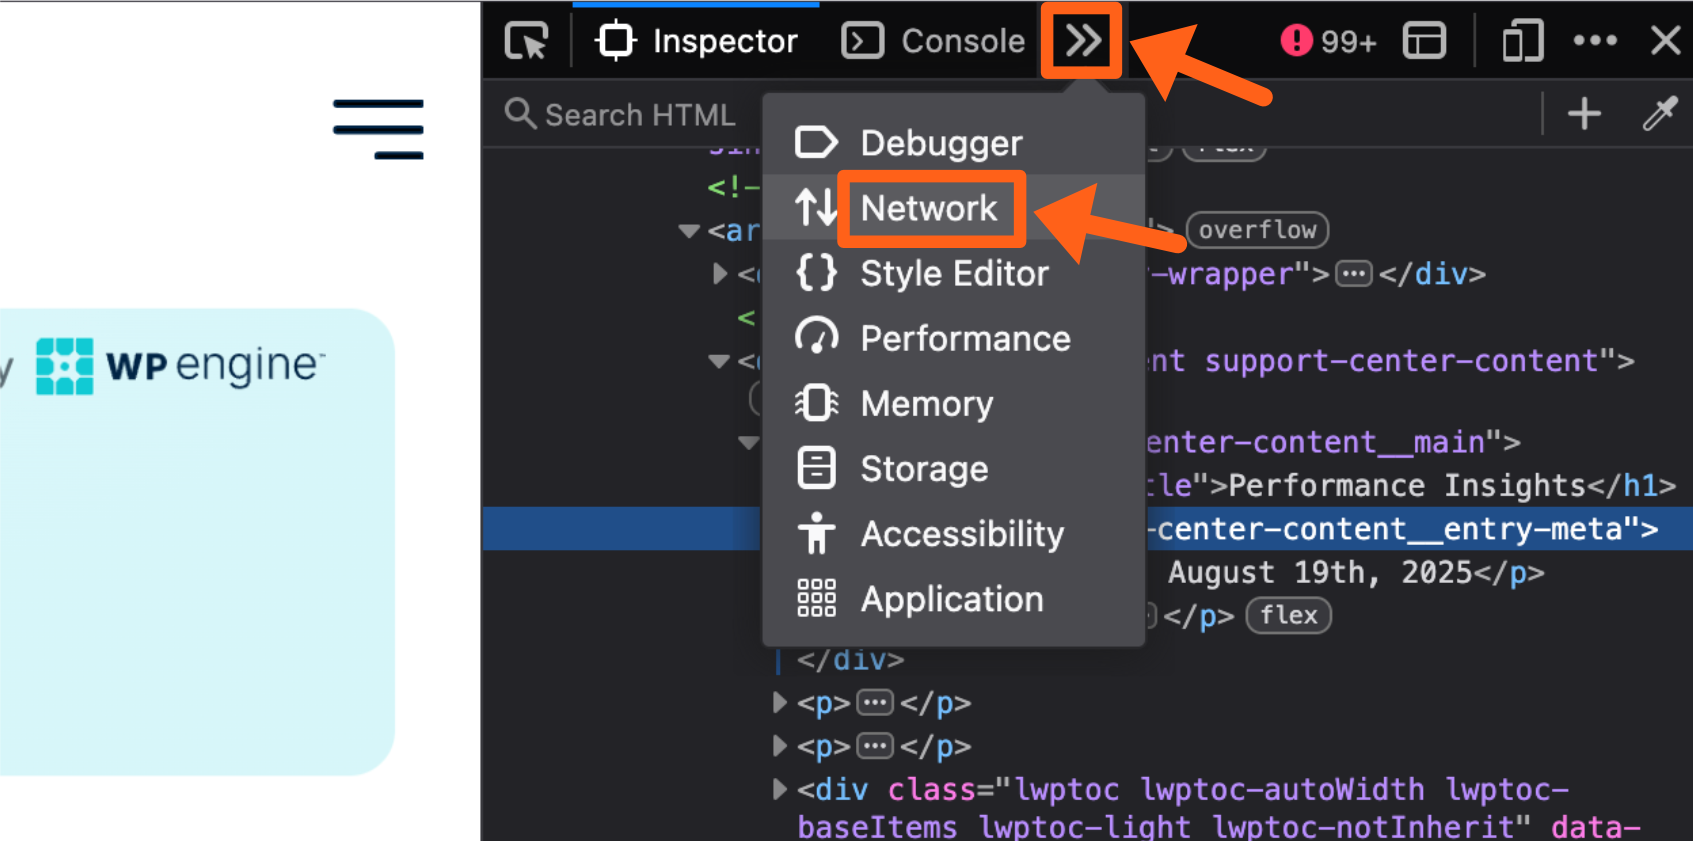
- Click on the Network tab at the top of the developer tools panel. You may have to click on the button with 2 right arrows, to see the list of tabs, if you have the developer panel condensed to a smaller width.
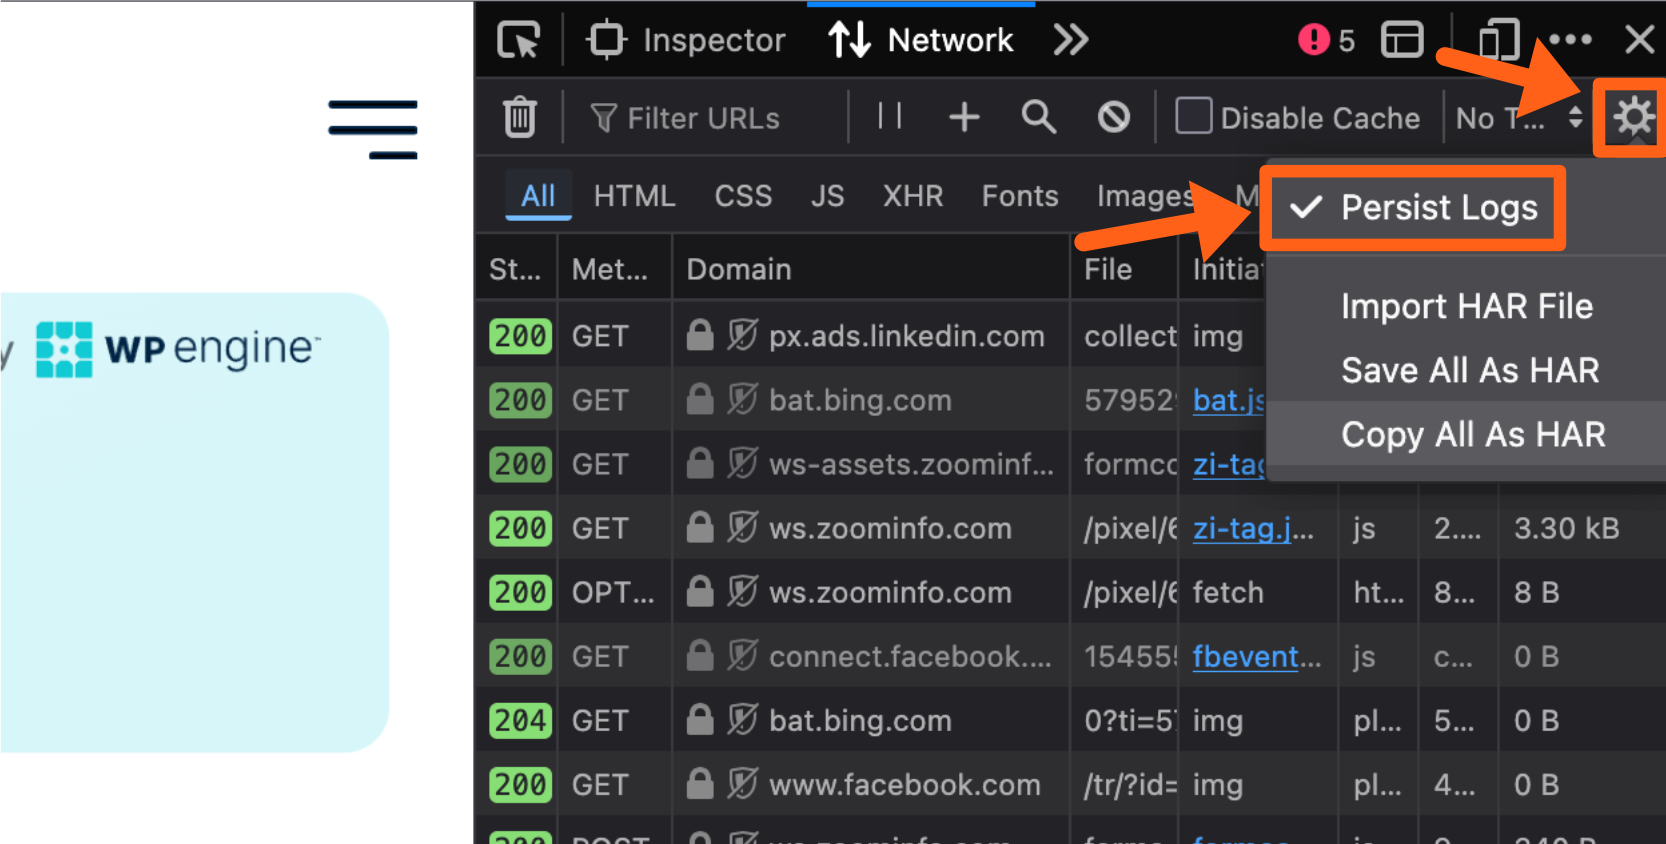
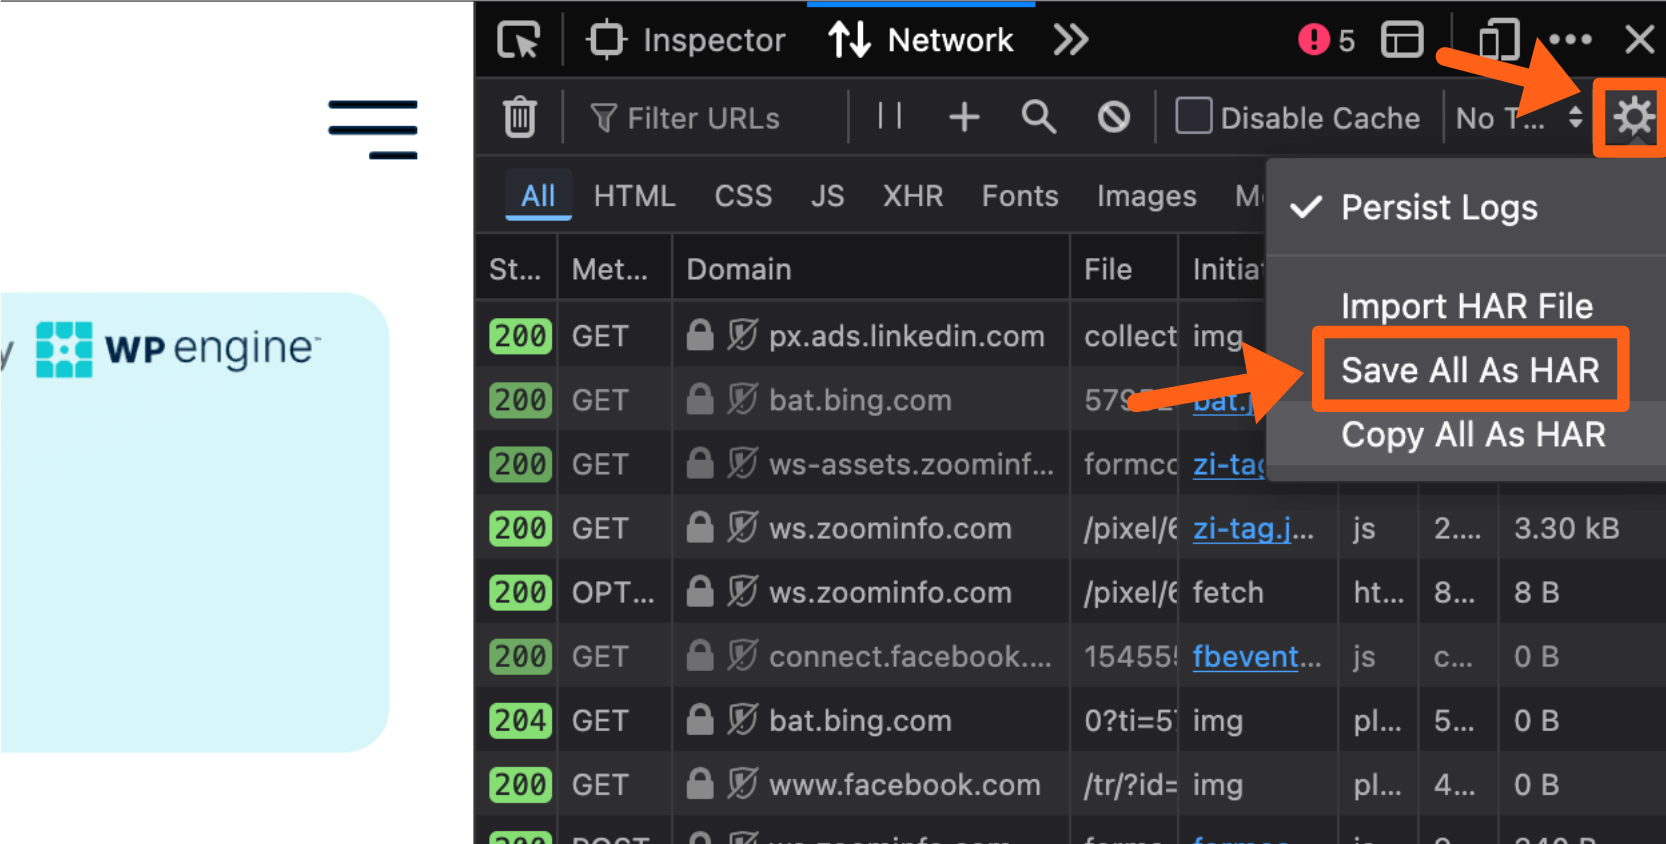
- Once you are on the Network tab, click the gear icon near the top right and make sure the Persist Logs option is checked.
- Refresh the web page and then recreate the issue that you are troubleshooting.
- When your issue is present on the page, click the gear icon in the top right, or right click anywhere in the requests list, and select Save All As HAR.
- After choosing the save option, you will have a file downloaded to your computer with a file extension of
.harthat you can provide to our support team.
Microsoft Edge
To generate a HAR file in the Microsoft Edge web browser:
- Go to the web page that you want to record, and right click anywhere on the page. Then select the Inspect option from the context menu.
Note: many factors change the menu items listed in the context menu, but you should still find the Inspect option somewhere in the list.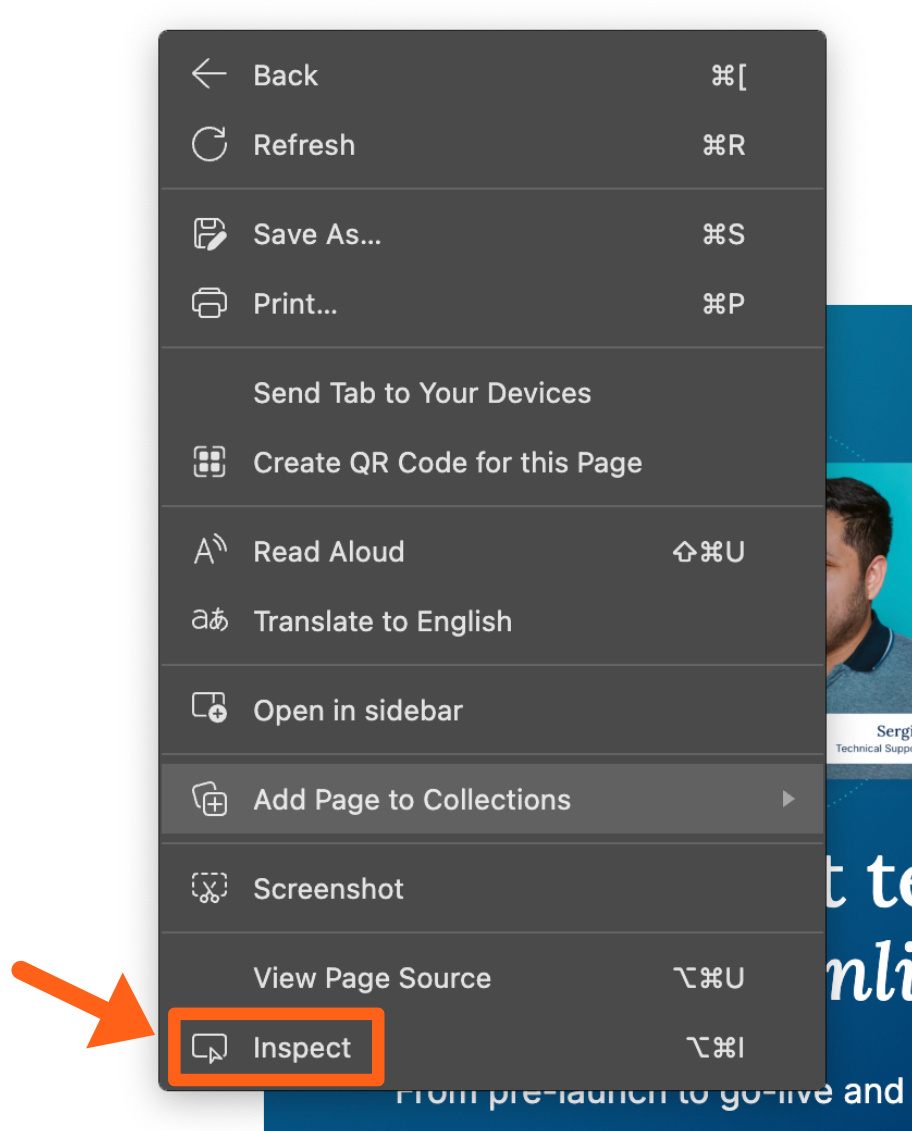
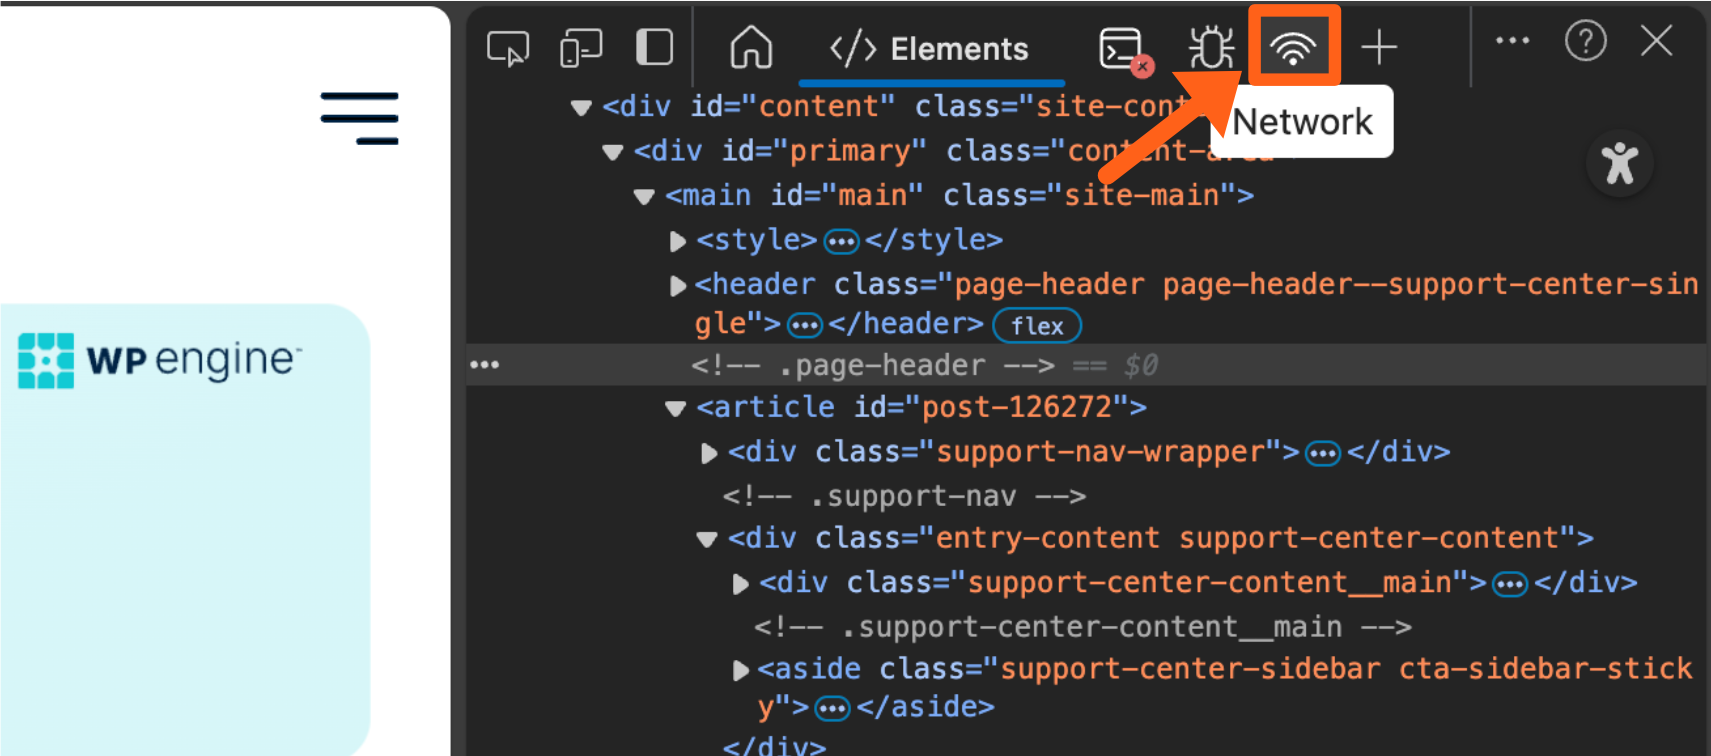
- In the developer tools panel, click on the Network tab. It will be a radio signal icon as pictured below. If you have condensed the width of the developer tools panel, all tabs will not be visible and you may have to click on the plus “+” icon to see all available tab options that you can select. The + icon is pictured next to the Network icon in the below screenshot.
- Locate the record button in the top left of the Network tab and make that sure that it is on. This will record network requests for the web page. When it is on you will see a message when you hover over it, that says “Stop recording network log”. It is on in the below screenshot. Also make sure that the Preserve log box is checked as shown below.
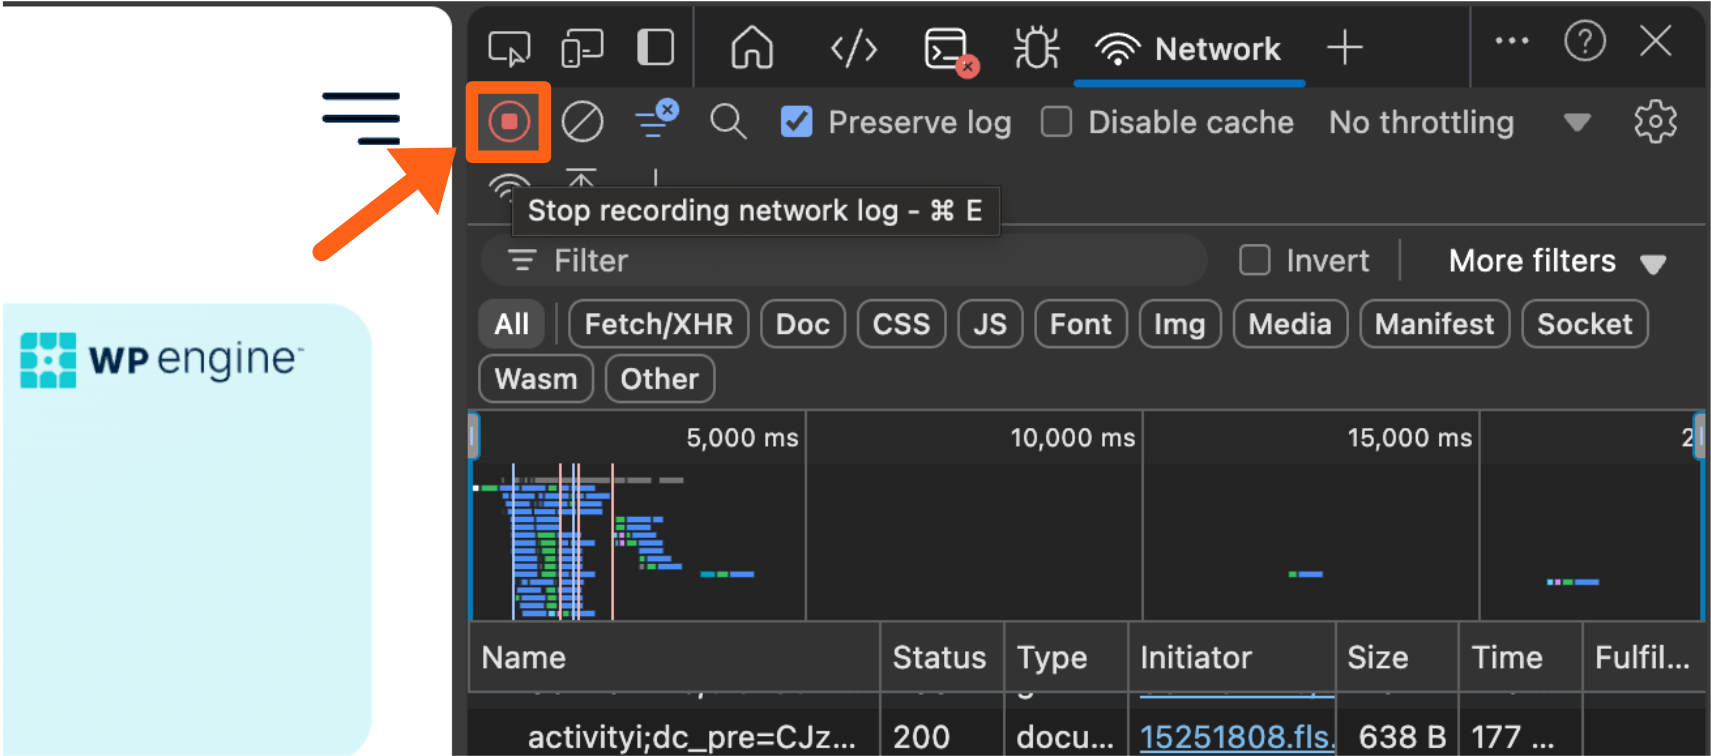
- Once the record button is enabled, refresh the web page, and recreate the issue that you are troubleshooting on the web page.
- When your issue is present on the page, click the Export HAR button. This will be a downward arrow icon as pictured below.
- After clicking the export button, you will have a file downloaded to your computer with a file extension of
.harthat you can provide to our support team.
Safari
To generate a HAR file in the Safari web browser:
- In Safari, ensure the Develop menu item appears above the browser window as pictured below.
- If you do not see the Develop menu item, then go to Safari > Settings in the menu above the browser window.
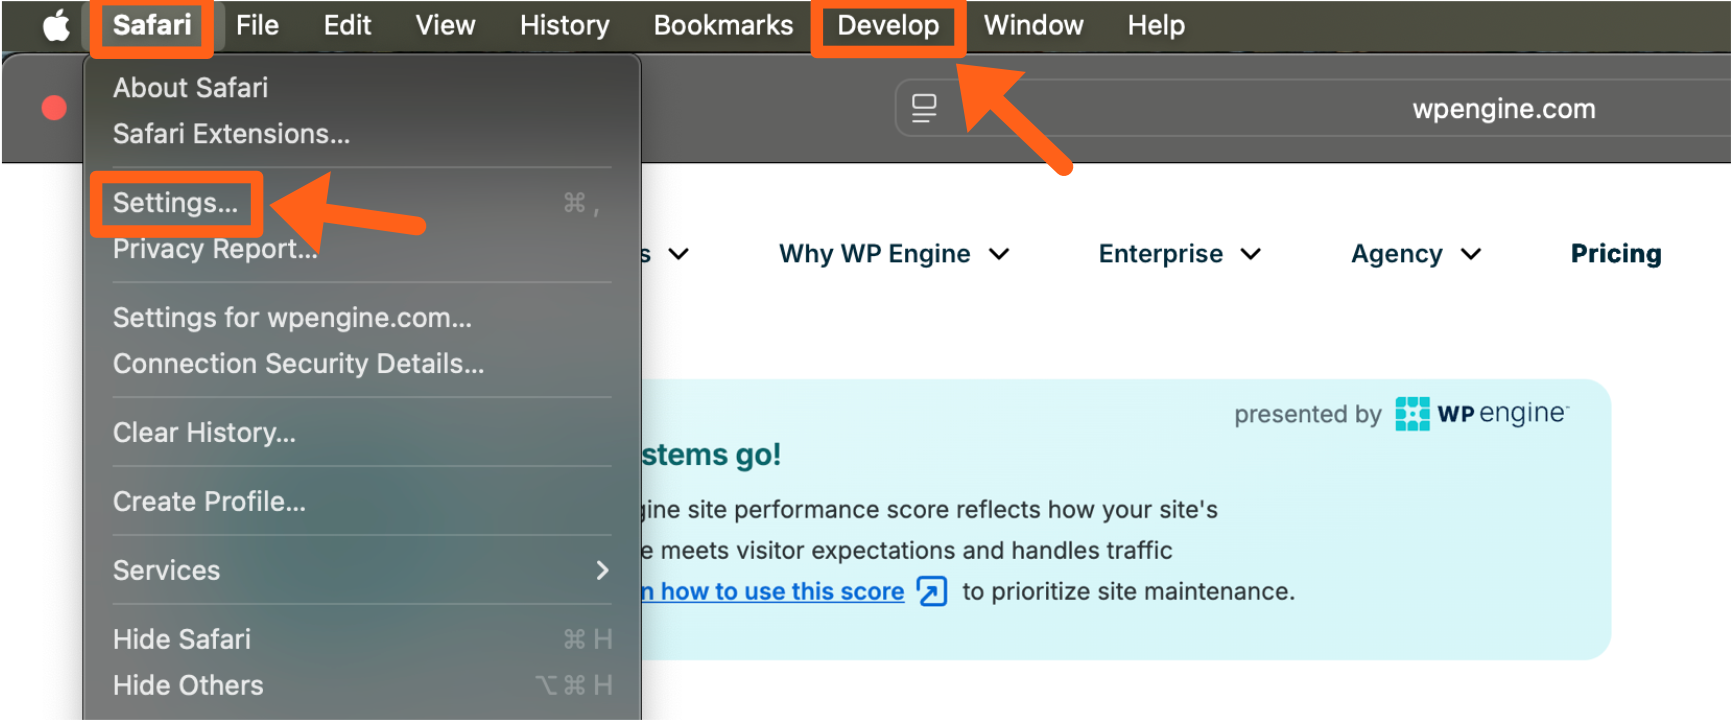
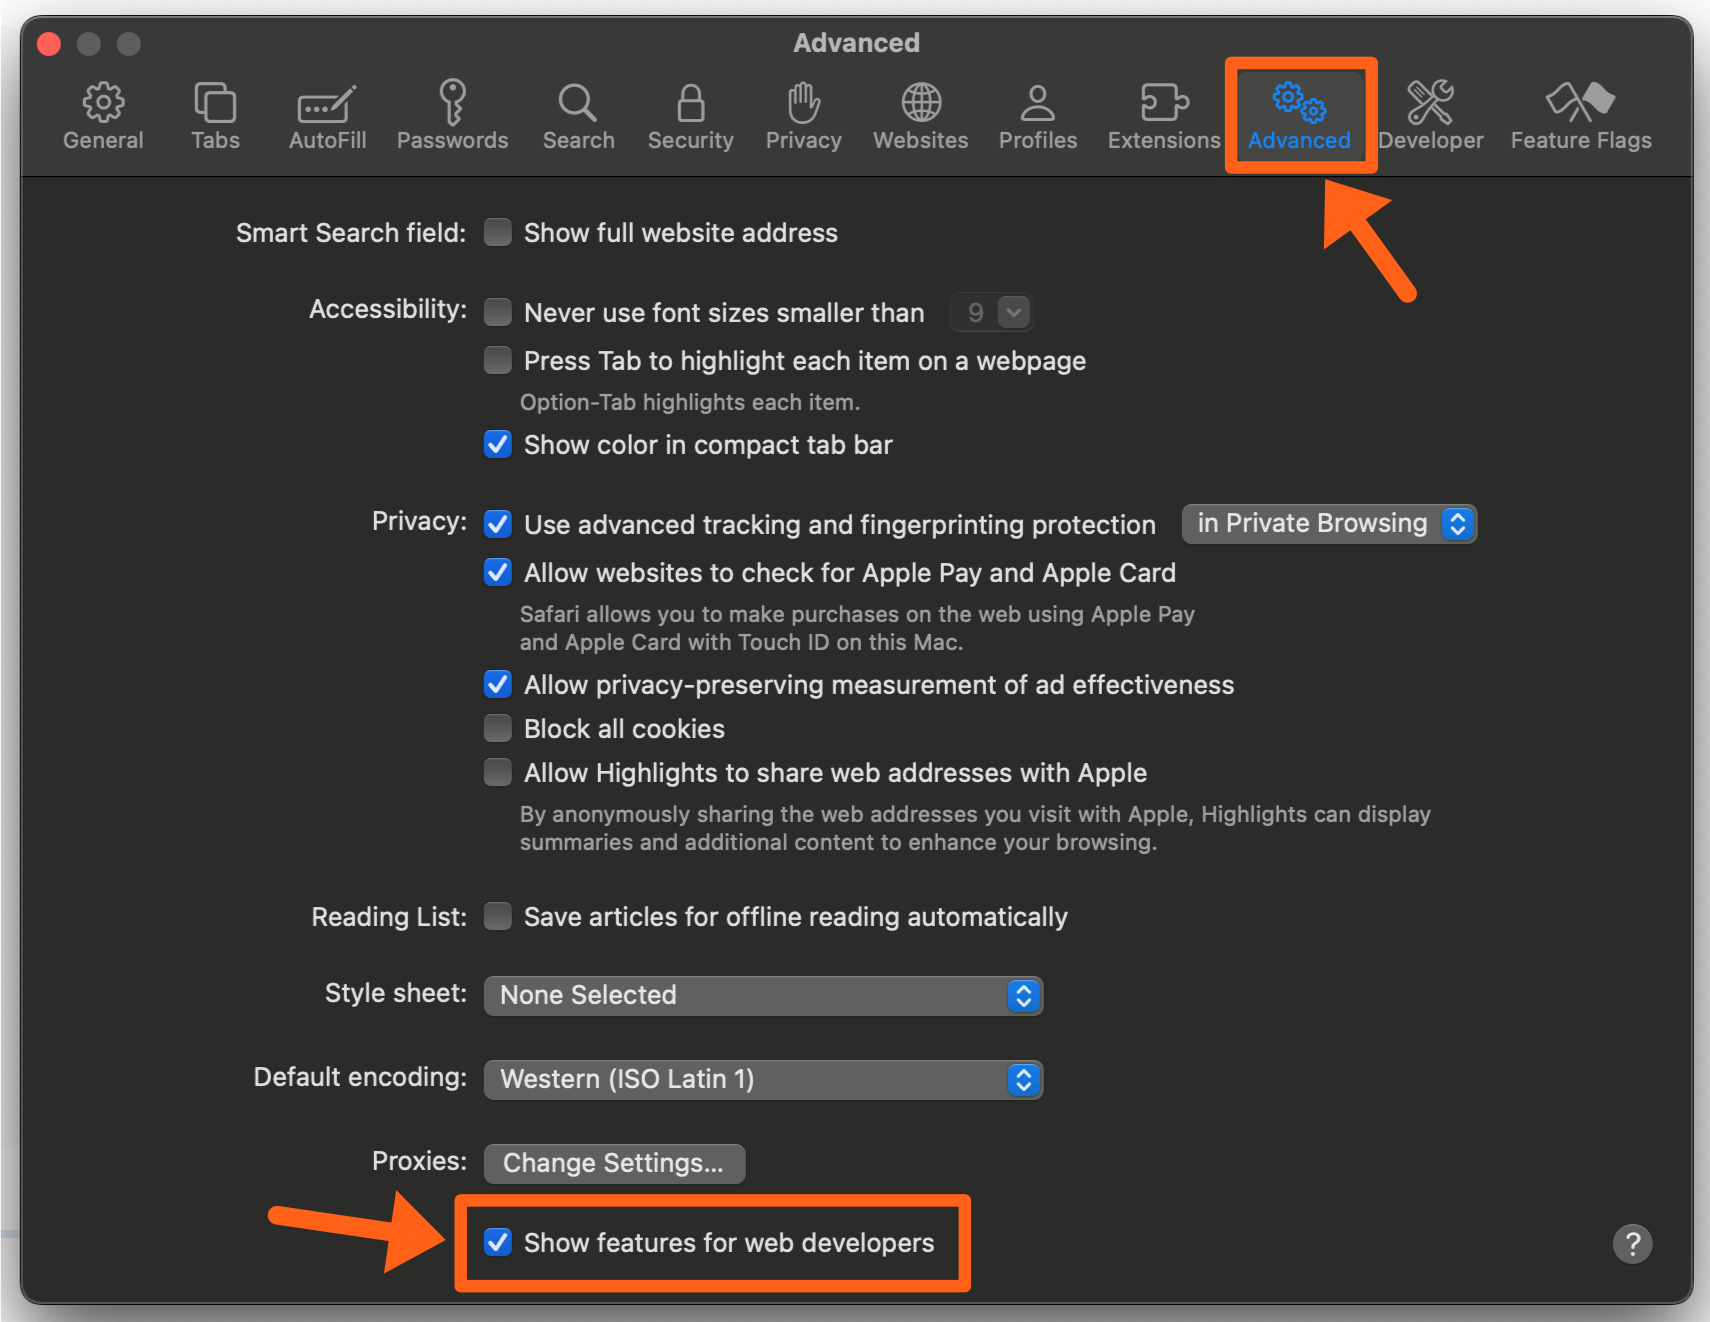
- To enable the Develop menu, click on the Advanced tab, and then check the box labeled Show features for web developers. Then you can close the settings popup window.
- If you do not see the Develop menu item, then go to Safari > Settings in the menu above the browser window.
- Navigate to the web page that you want to record and then right click anywhere on the page and choose the Inspect Element option from the context menu.
Note: many factors change the menu items listed in the context menu, but you should still find the Inspect Element option somewhere in the list.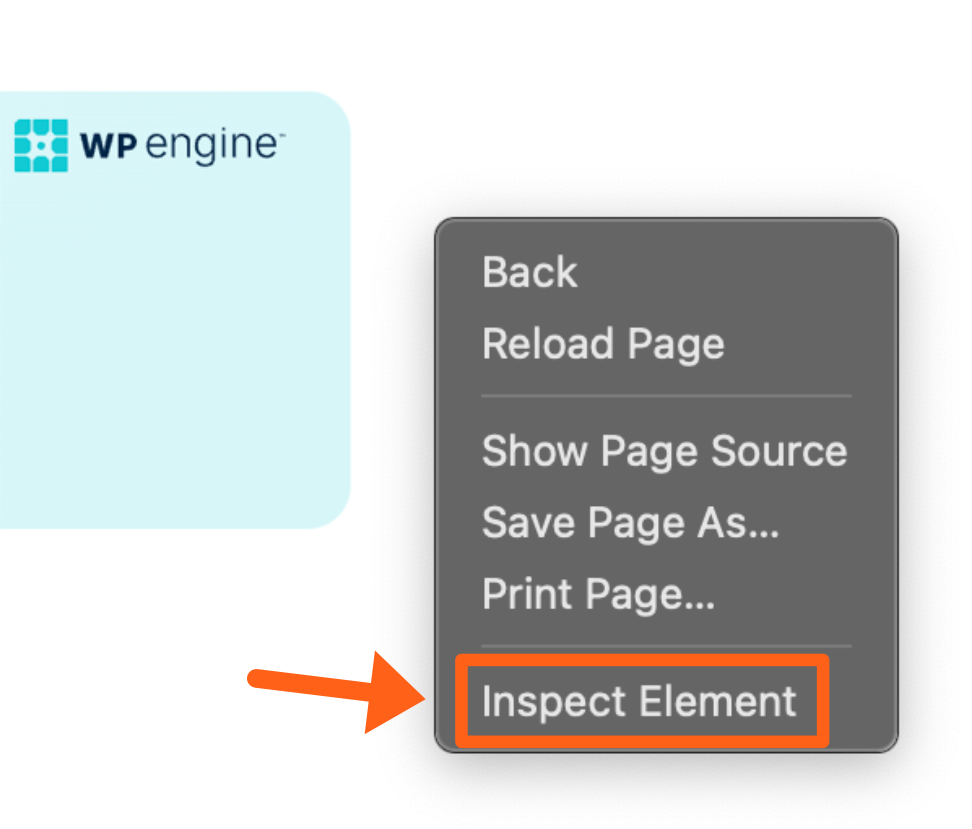
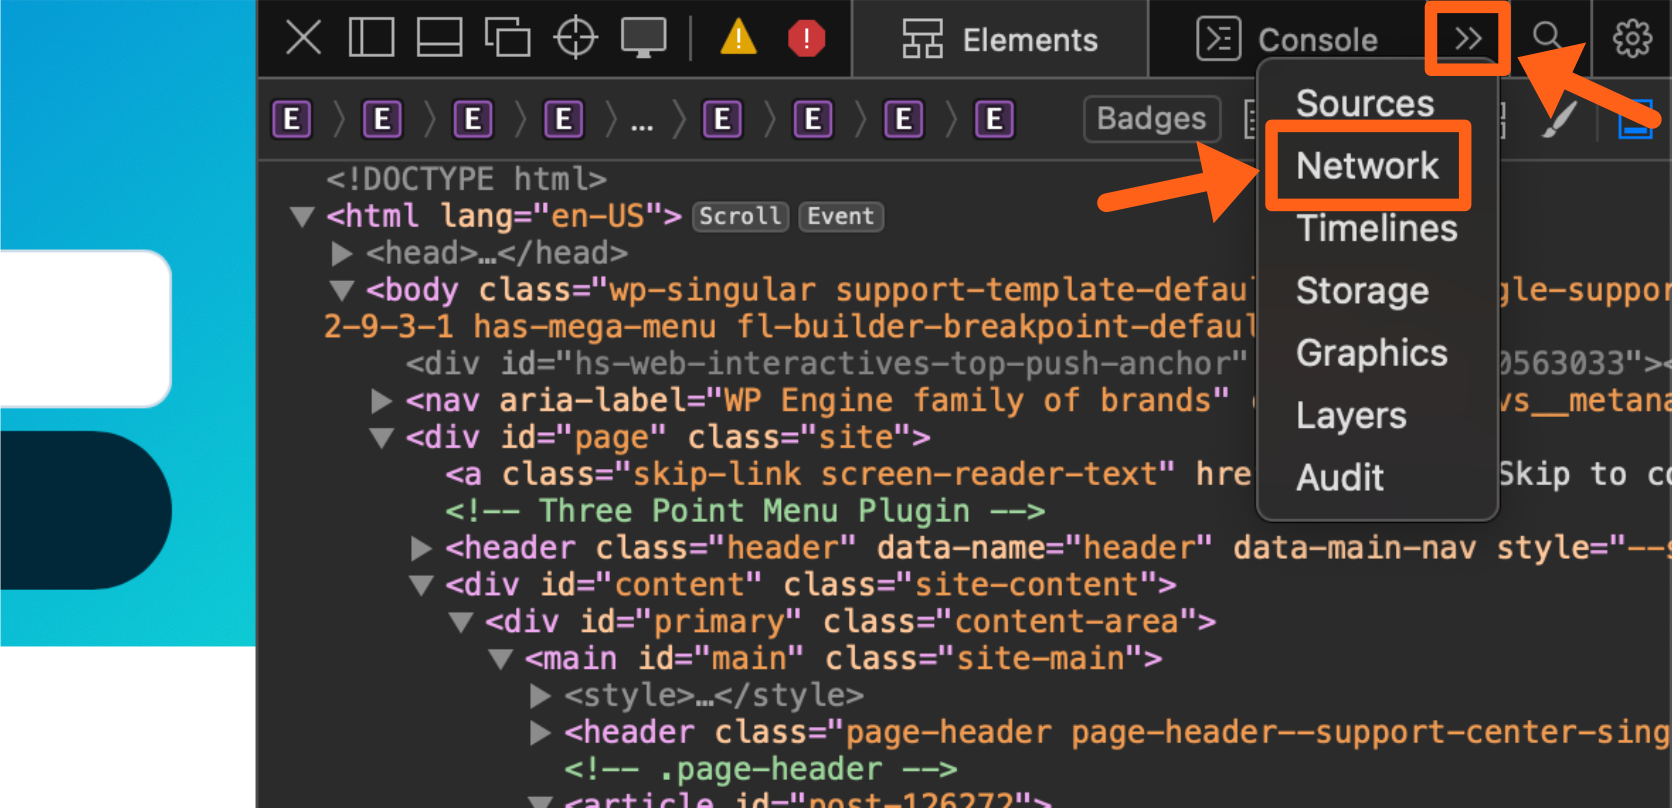
- Click on the Network tab at the top of the developer tools panel. You may have to click on the button with 2 right arrows, to see the list of tabs, if you have the developer panel condensed to a smaller width.
- Once on the Network tab, refresh the web page and then recreate the issue that you are troubleshooting.
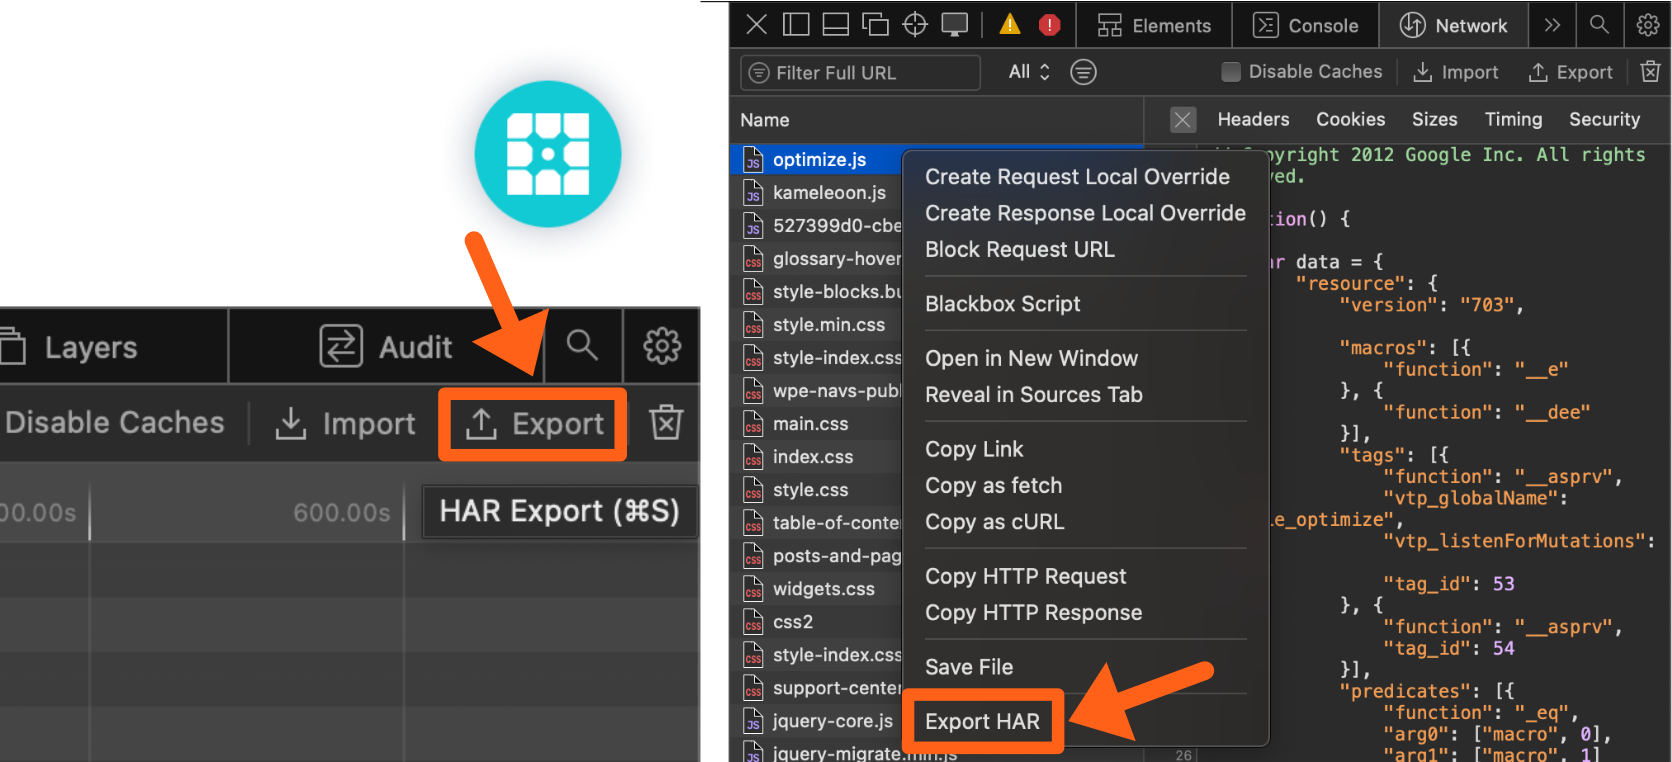
- When your issue is present on the page, click the HAR Export button. If you have your developer tools panel expanded to a wide width, then you can simply click the button labeled Export. Otherwise you can right click any of the network request names in the list and then choose Export HAR from the context menu. Both options are pictured below.
- After clicking the export button, you will have a file downloaded to your computer with a file extension of
.harthat you can provide to our support team.