Get Started
New Relic Dashboards
Tags:
Key Takeaways
New Relic Dashboards offer code-level application performance monitoring. Utilize the free New Relic One dashboard to visualize data and understand your business better.
Create customized dashboards with NRQL queries tailored to WordPress users. Visualize data on eCommerce, server health, and more with intuitive widgets.
Follow simple steps to create a dashboard on New Relic One. Name, select account, add widgets with NRQL queries, and enjoy real-time data updates.
Learn more about NRQL queries and data manipulation in the New Relic One documentation. Enhance your understanding of data visualization and customization for improved insights.
WP Engine and New Relic have partnered to offer Application Performance (Formerly called “Application Performance Monitoring” or “APM”). Deliver faster site speed and increased stability with code-level application performance monitoring.
If your plan includes New Relic Application Performance, these steps can help you utilize the free New Relic One dashboard to visualize data and to better understand your business.
If your plan does not include New Relic Application Performance, reach out to your WP Engine Account Manager for more information.
Visualizing Data
There are a multitude of ways that New Relic users can create dashboards to visualize their data, focusing on anything from eCommerce to server health.
A dashboard is comprised of various widgets using either NRQL (New Relic Query Language) or basic.
WP Engine has created a handful of NRQL queries to make building a dashboard in New Relic One easy and intuitive. These widgets are customized to WordPress® users and give teams a simplified way to visualize data.1 The following example depicts these queries and data as widgets from three sample WP Engine properties.
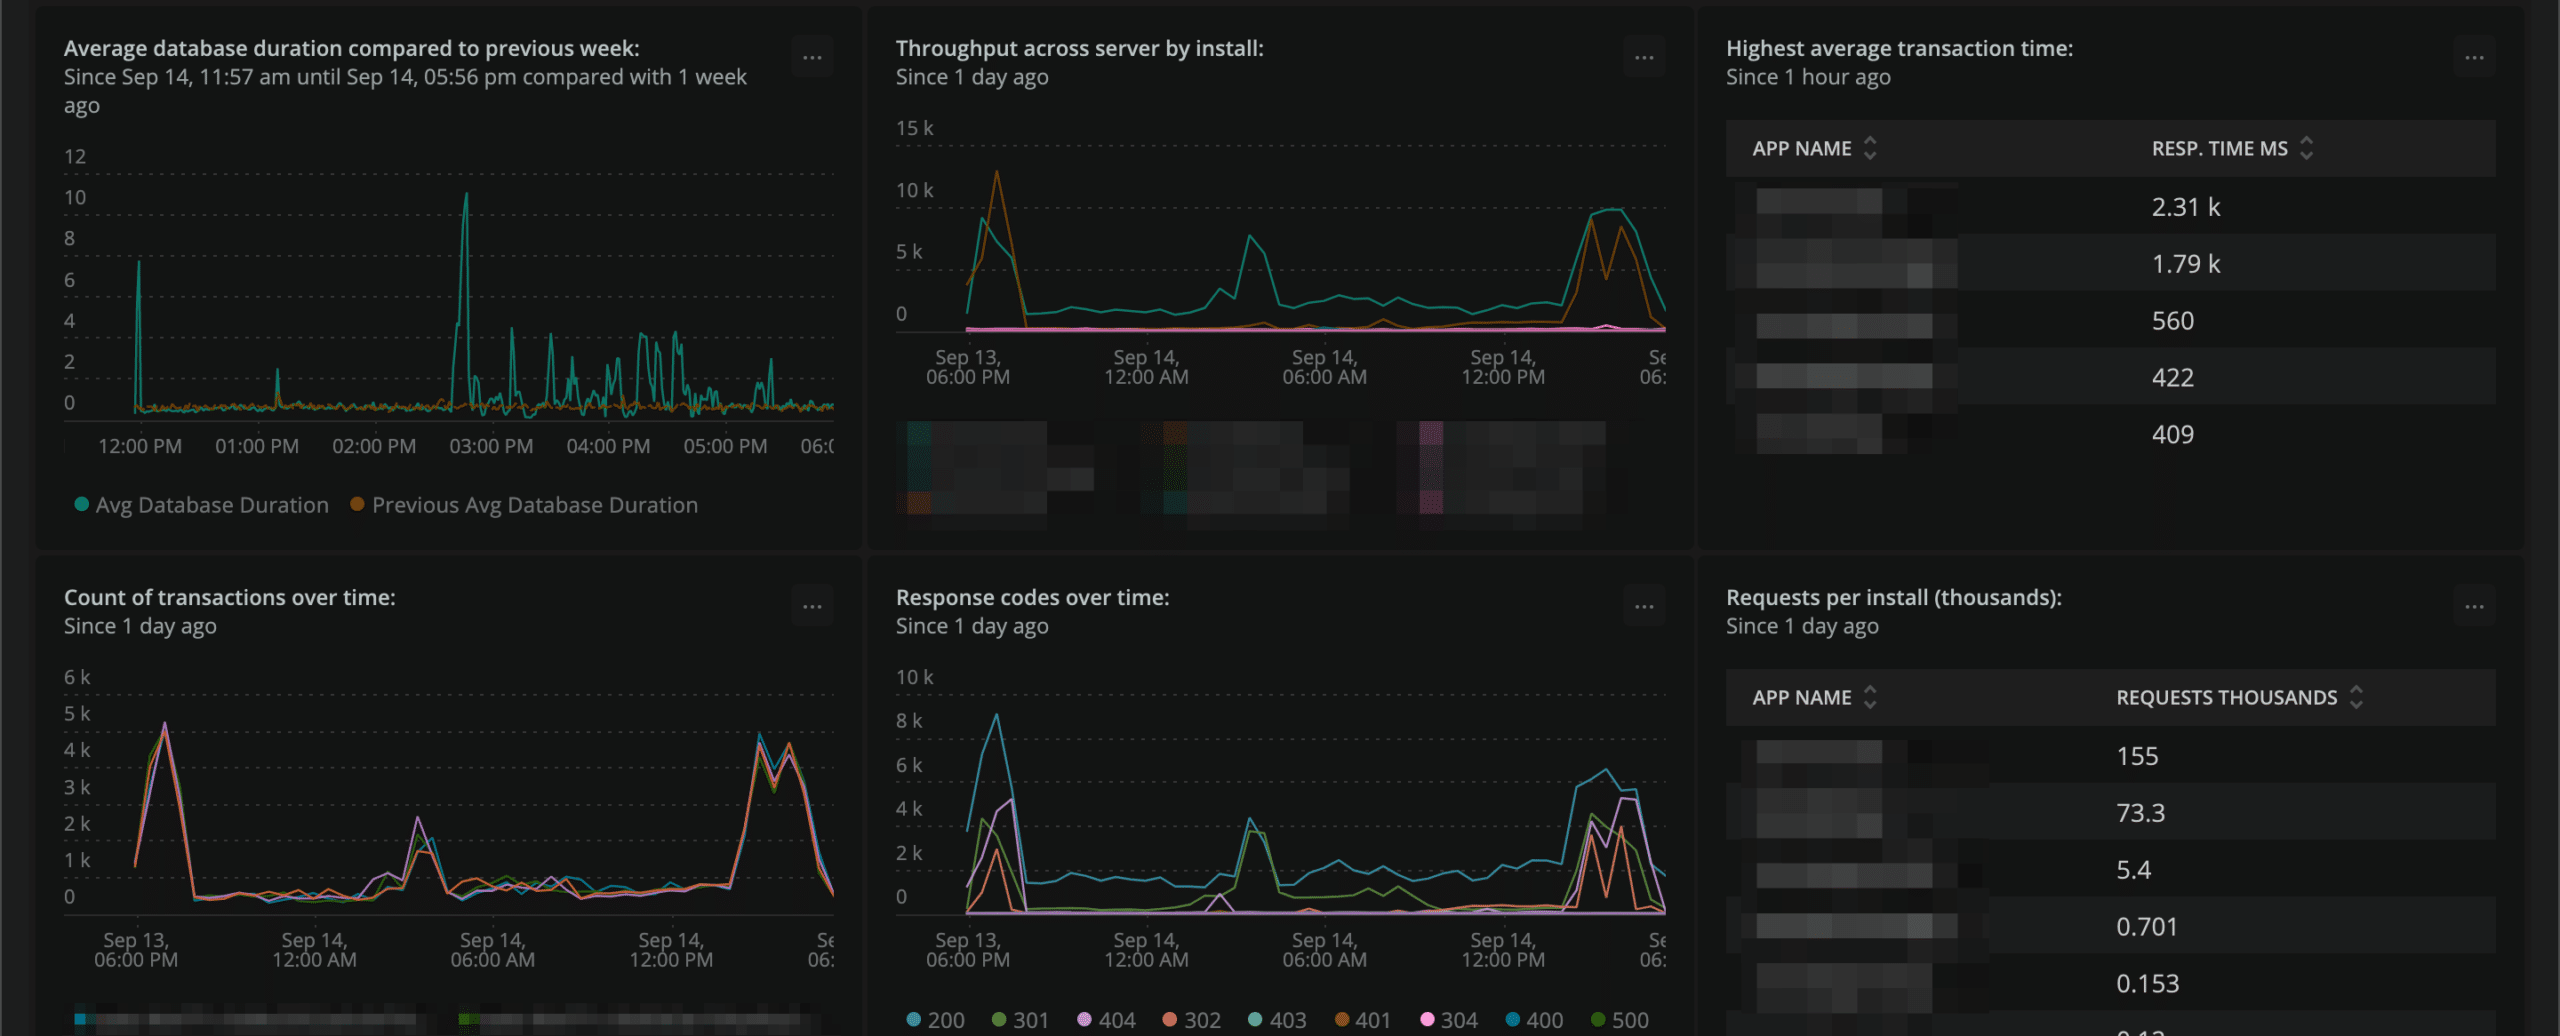
If you wish to expand, change or display other information, you can find examples of NRQL queries to create your own custom widgets here.
Create a Dashboard
- Log into One.NewRelic.com
- If Application Performance is not included in your plan already, please contact your WP Engine Account Manager to learn more.
- From the New Relic One homepage, select Dashboards
- Click Create a dashboard

- Name the dashboard something easily identifiable
- Ensure the correct Account is selected from the dropdown
- Click the plus sign
+Add a new chart (hover over the blank squares) - Select Add a chart
- Click NRQL query
- Enter your widget’s NRQL
- Alternatively, you can also select PromQL-Style or Basic from the top right.
- Click Run and Save
Once a widget has been added, the dashboard will update with data automatically. If you wish to further customize the dashboard with images or graphics, when adding a widget, select Add text, images or links instead. Enjoy the fresh visualization of your data within Application Performance!
To learn more about NRQL queries and how to manipulate the data to what’s most important to you and your company, see the New Relic One documentation here.
Sample NRQL for Widgets
Here are the NRQL queries used to create the widgets in the WP Engine dashboard shown in the example at the start of this article. You will need to modify these examples to fill in the name of the environment, denoted as APPNAME, where specified. Multiple environments may need to be filled in.
Synthetic Check Uptime
This requires synthetic monitors to be configured first. WP Engine’s APM product extension includes synthetic monitors lite, meaning a PING monitor will be the only available option. Be sure to update the following with the corresponding monitor names.
SELECT percentage(count(*), WHERE result='SUCCESS') FROM SyntheticCheck where monitorName='MONITORNAME1' or monitorName='MONITORNAME2' or monitorName='MONITORNAME3' since 24 hours ago facet monitorName
Site Apdex Scores
Duration t should be set to the Apdex T-Value. Default value is .5
SELECT apdex(duration, t: .5) as 'Apdex Score' FROM Transaction where appName='APPNAME' or appName='APPNAME2' or appName='APPNAME3' since 30 minutes ago compare WITH 1 day ago facet appName
Site Average Response Time
SELECT average(duration) * 1000 FROM Transaction where appName='APPNAME' or appName='APPNAME2' or appName='APPNAME3' since 30 minutes ago compare with 1 day ago facet appName
Total Transaction Throughput
SELECT count(*) FROM Transaction where appName='APPNAME' since 30 minutes ago TIMESERIES
Site PHP Errors
SELECT Count(*) as 'PHP Errors' from TransactionError where appName='APPNAME' and error.class NOT LIKE 'E_WARNING' since 30 minutes ago COMPARE WITH 1 day ago
External Calls Per Minute
SELECT rate(count(apm.service.transaction.external.duration), 1 minute) as 'External calls per minute' FROM Metric WHERE appName='APPNAME' LIMIT 5 SINCE 1800 seconds AGO TIMESERIES
External Calls Per Minute by External Host
SELECT count(apm.service.external.host.duration) FROM Metric WHERE appName='APPNAME' FACET `external.host` LIMIT 5 SINCE 30 minutes ago TIMESERIES
NEXT STEP: Learn more about Application Performance with New Relic