Site Reports
The new Site Report lets you quickly get a 360 degree view of the health and performance of your production environment websites. This new report pulls together information about how your website is configured and includes information and links to help you better manage your website. Reports are created in PDF format.
Site Reports are available on Billable production environments that are at least one month old and have at least one Lighthouse report available. Reports can’t be run on Transferable or Sandbox sites.
Access the Site Report Page
The Site Report tool for an environment can be accessed in the WP Engine User Portal by all users who have access to the given environment.
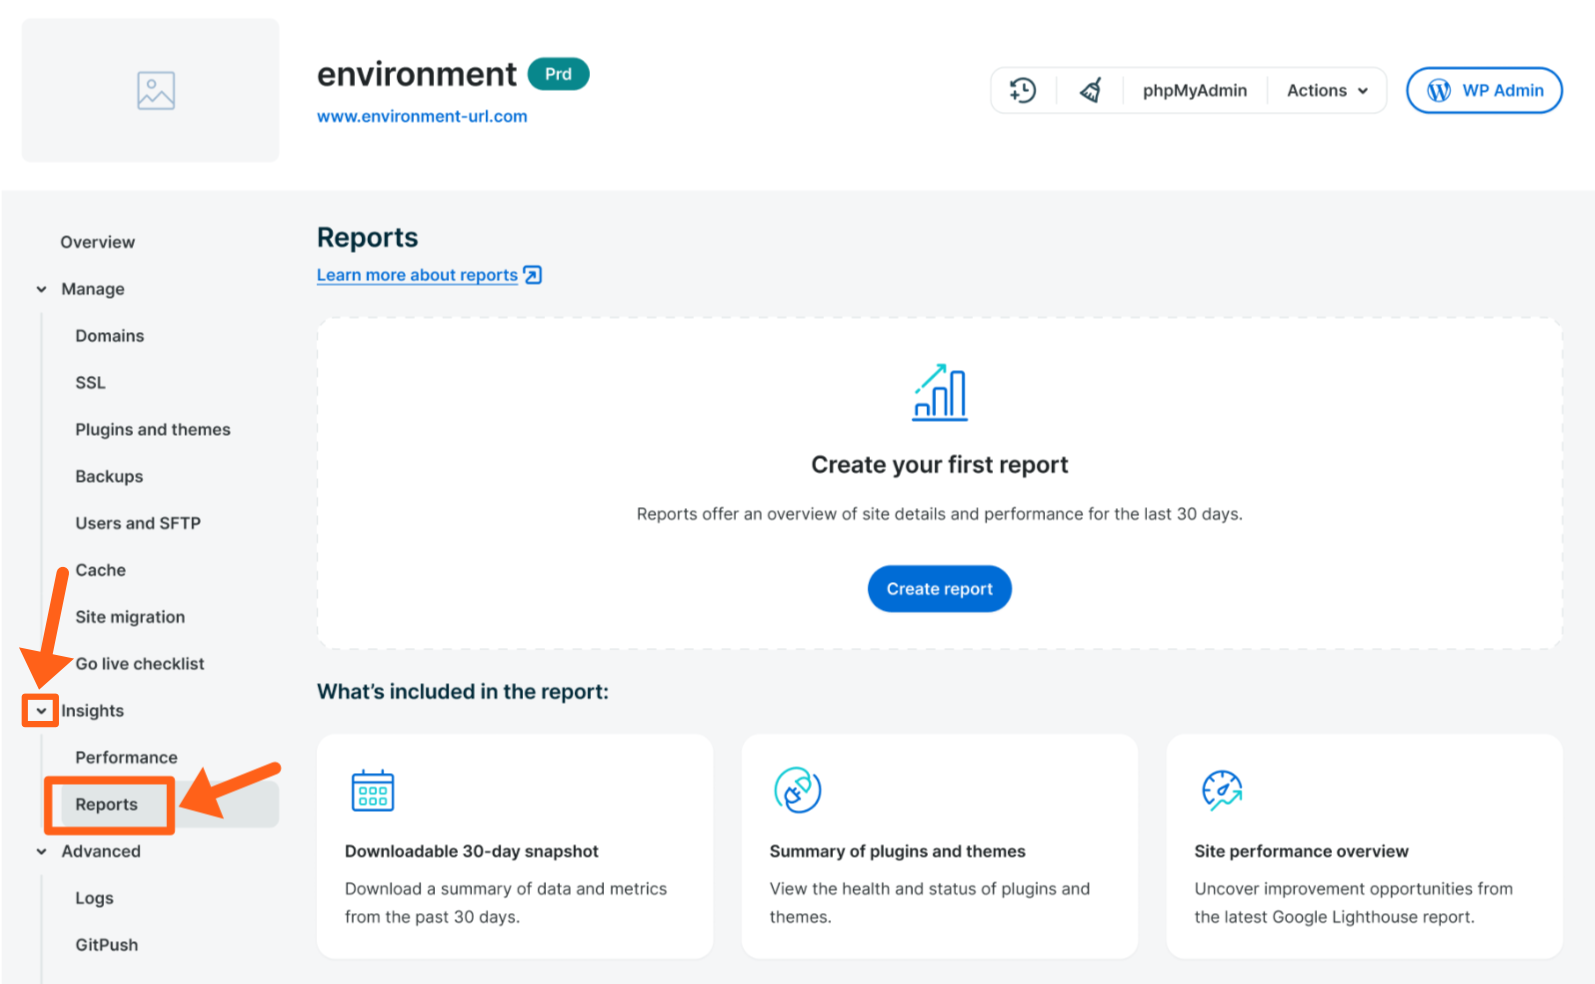
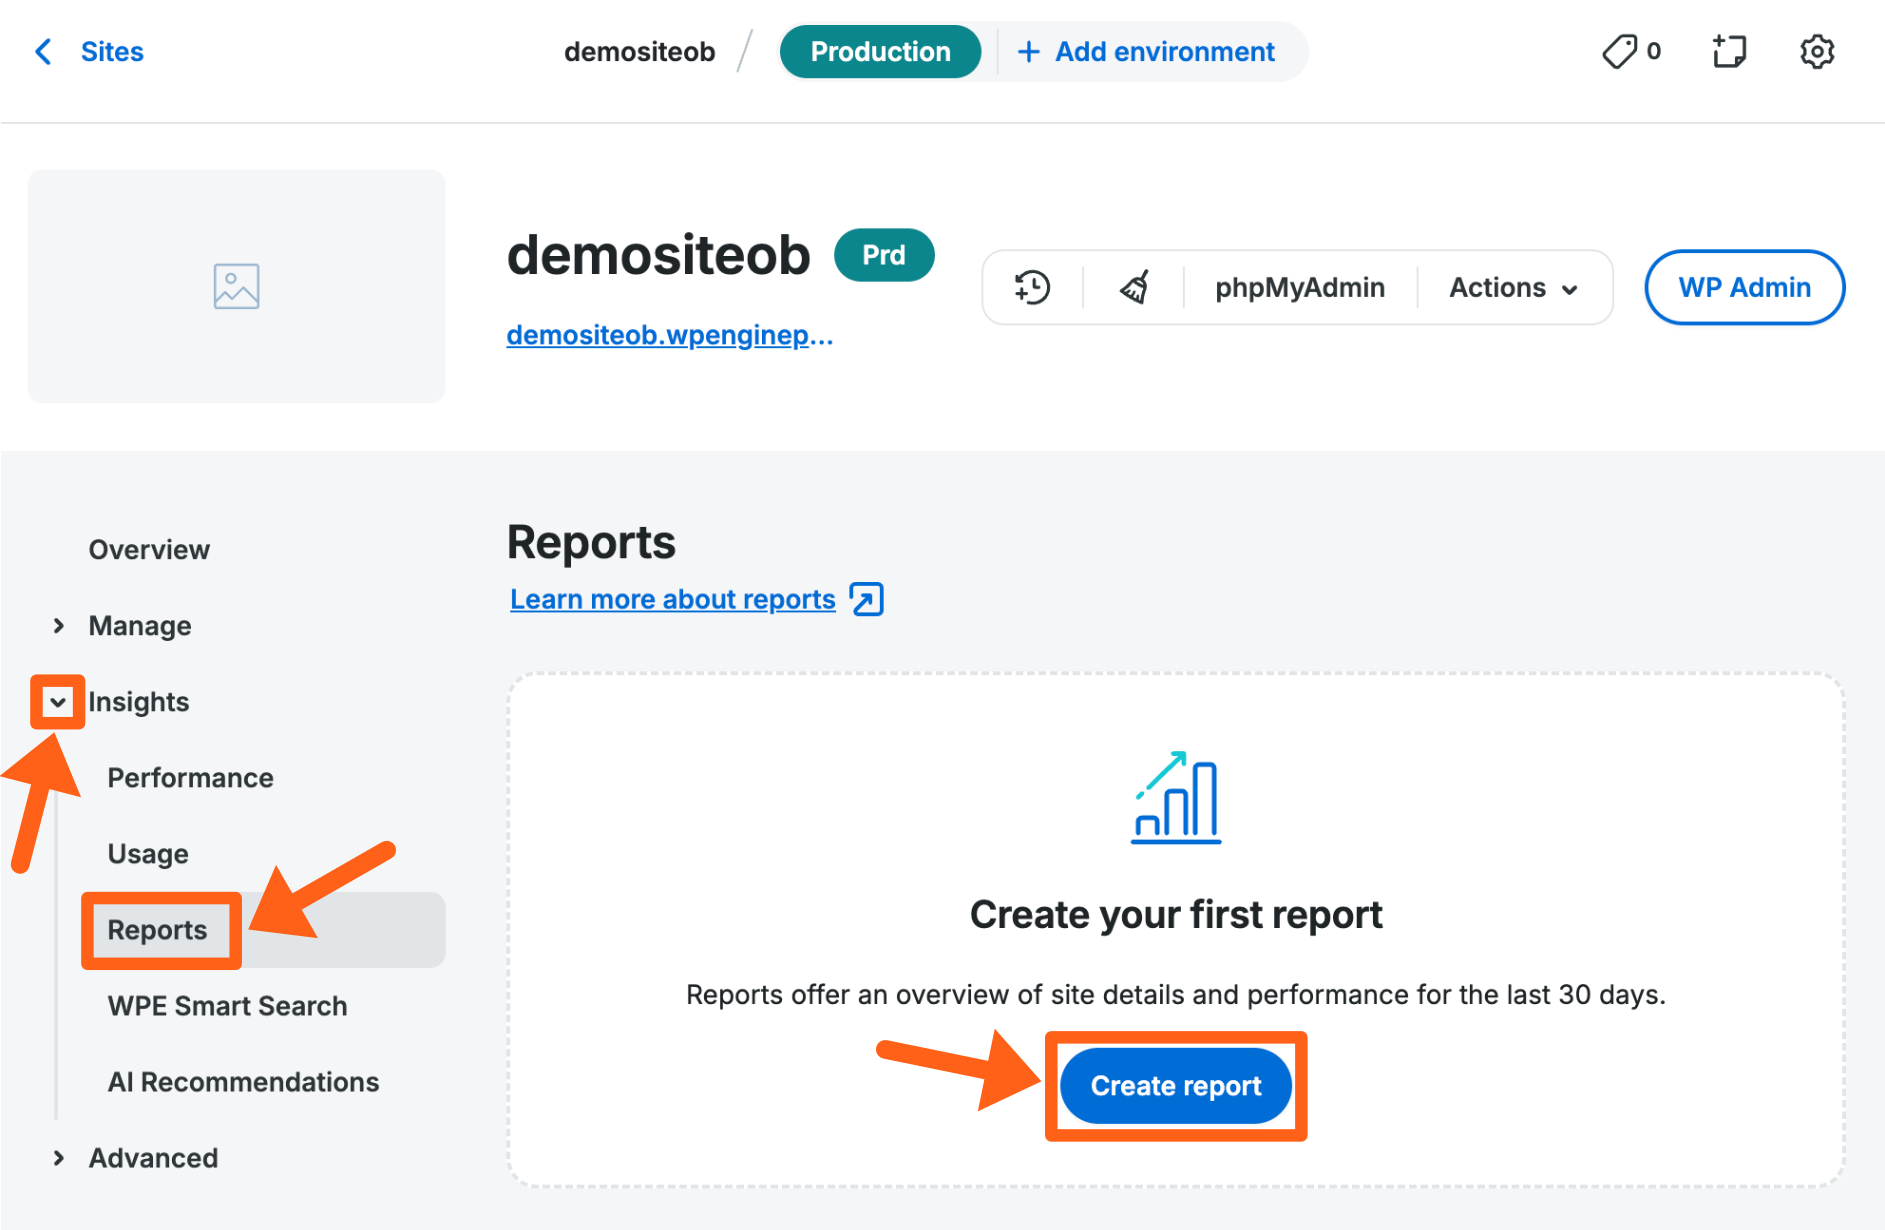
- From the User Portal, select the production environment you want to run a report on.
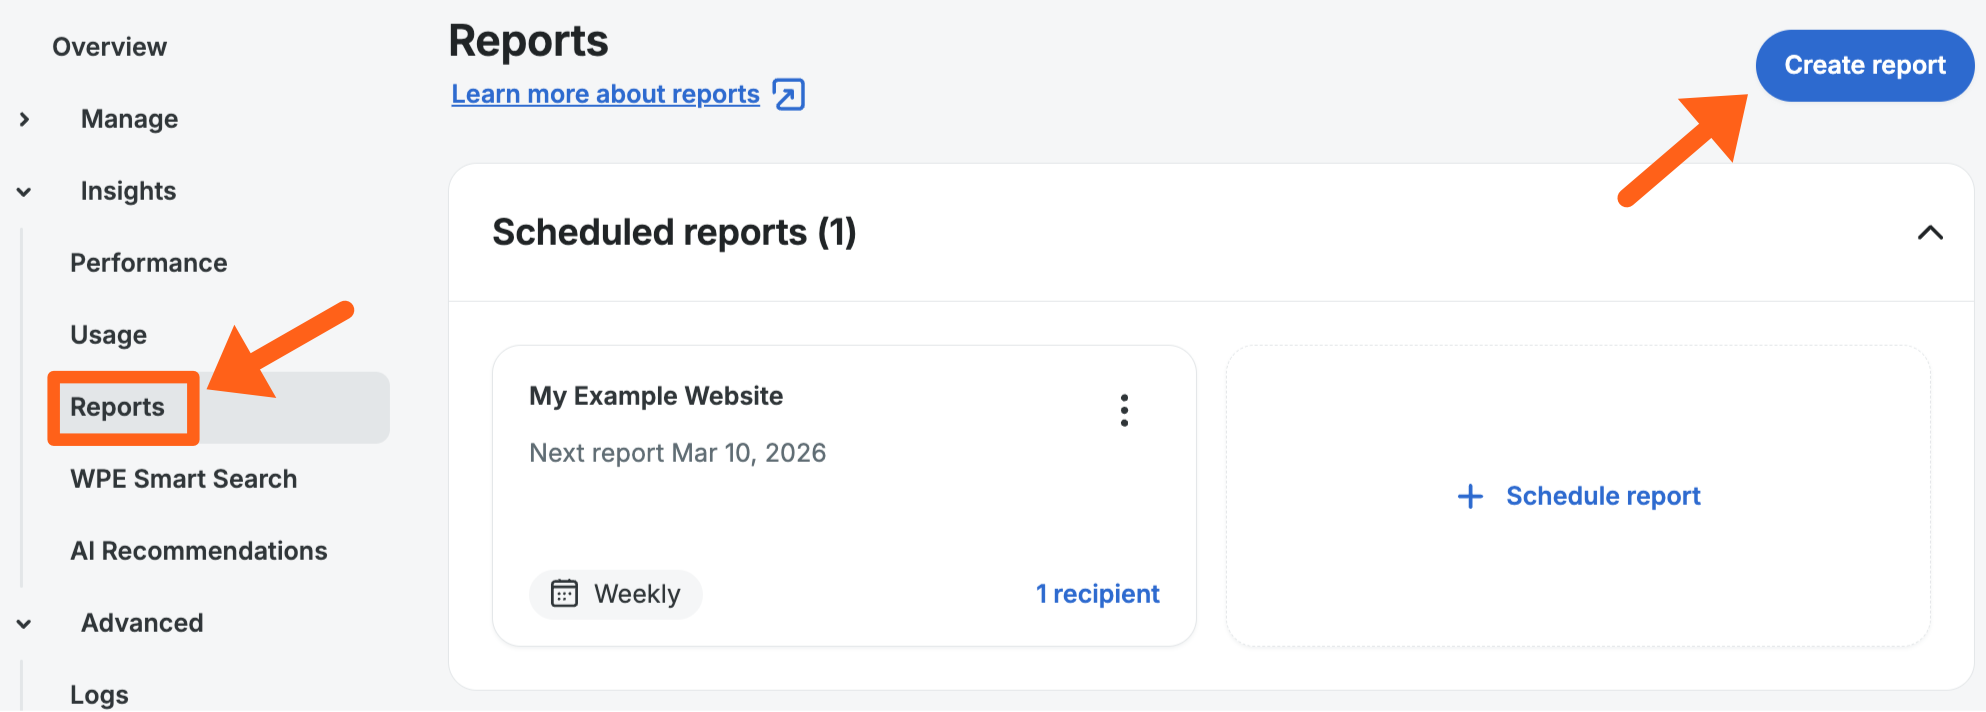
- Expand the Insights section in the secondary lefthand menu and click Reports.
Create a Report
To create a report:
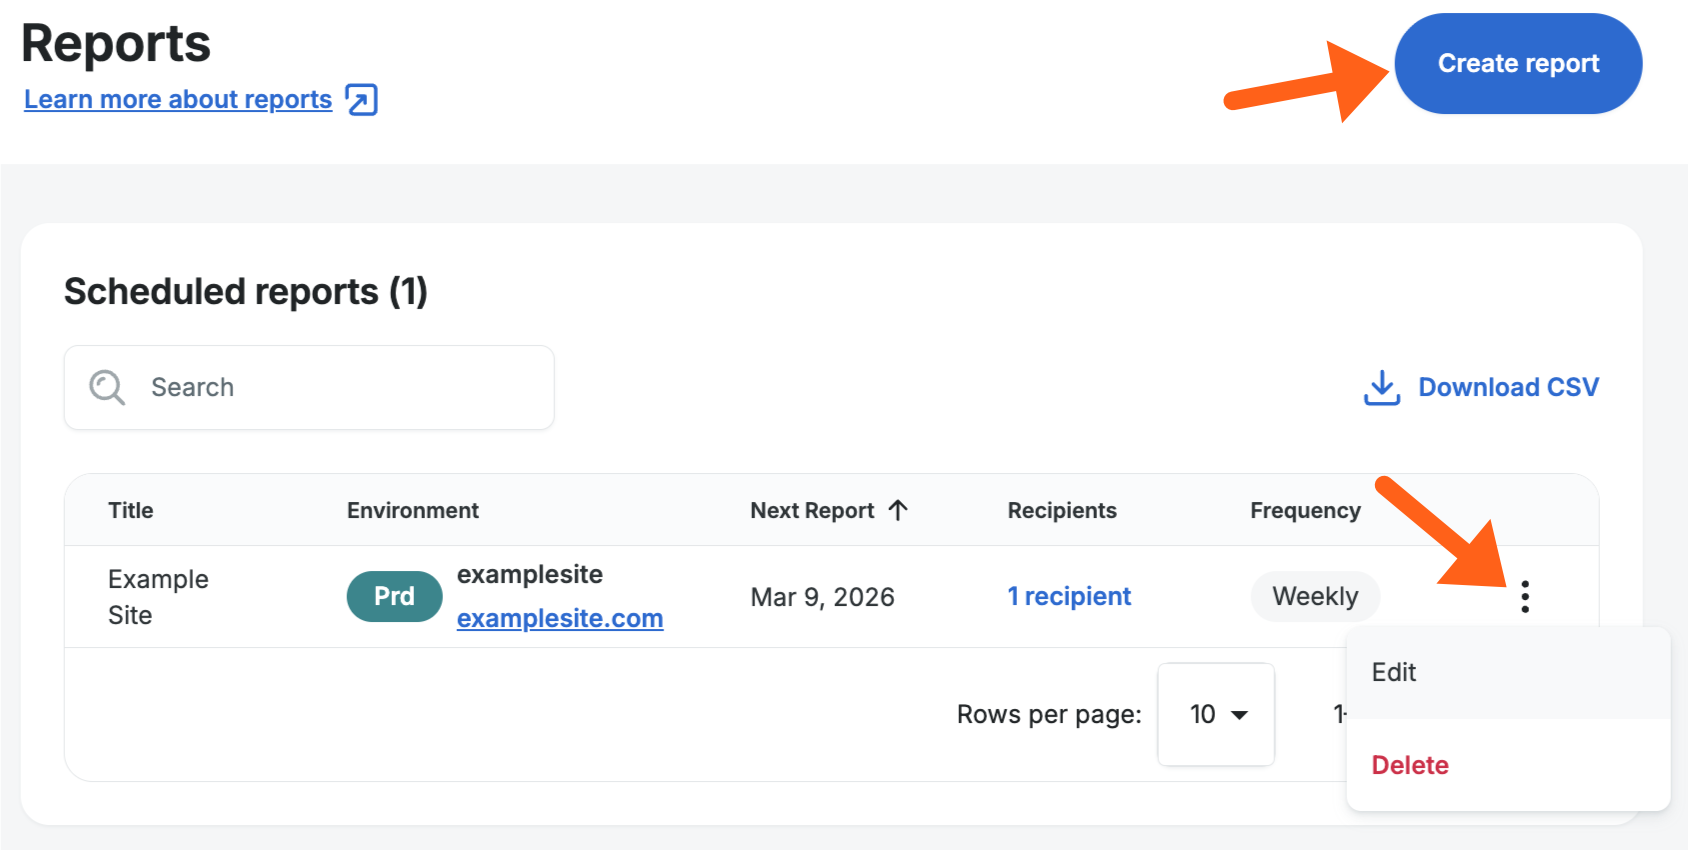
- Click the Create report button on the Reports page as shown above.
Reference the below image for the options in the next steps: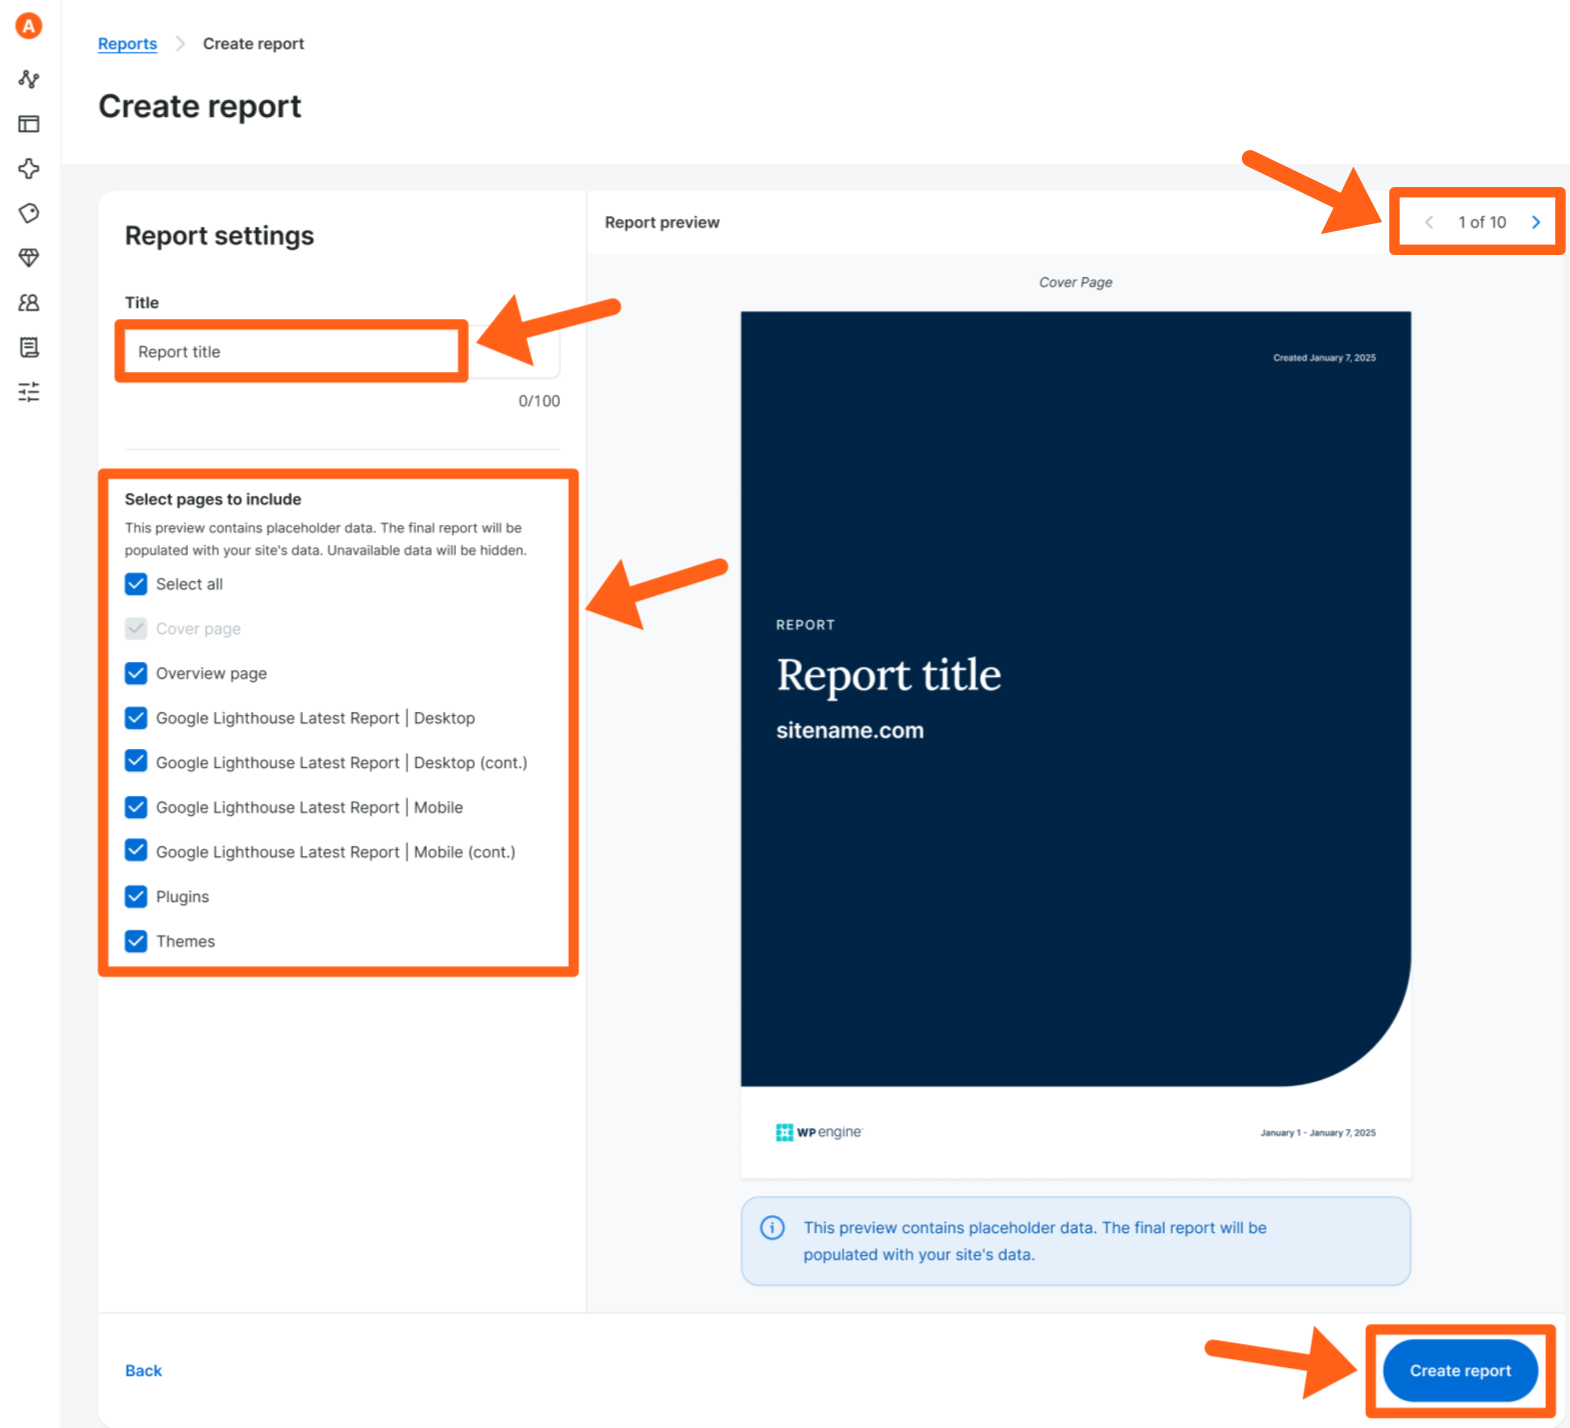
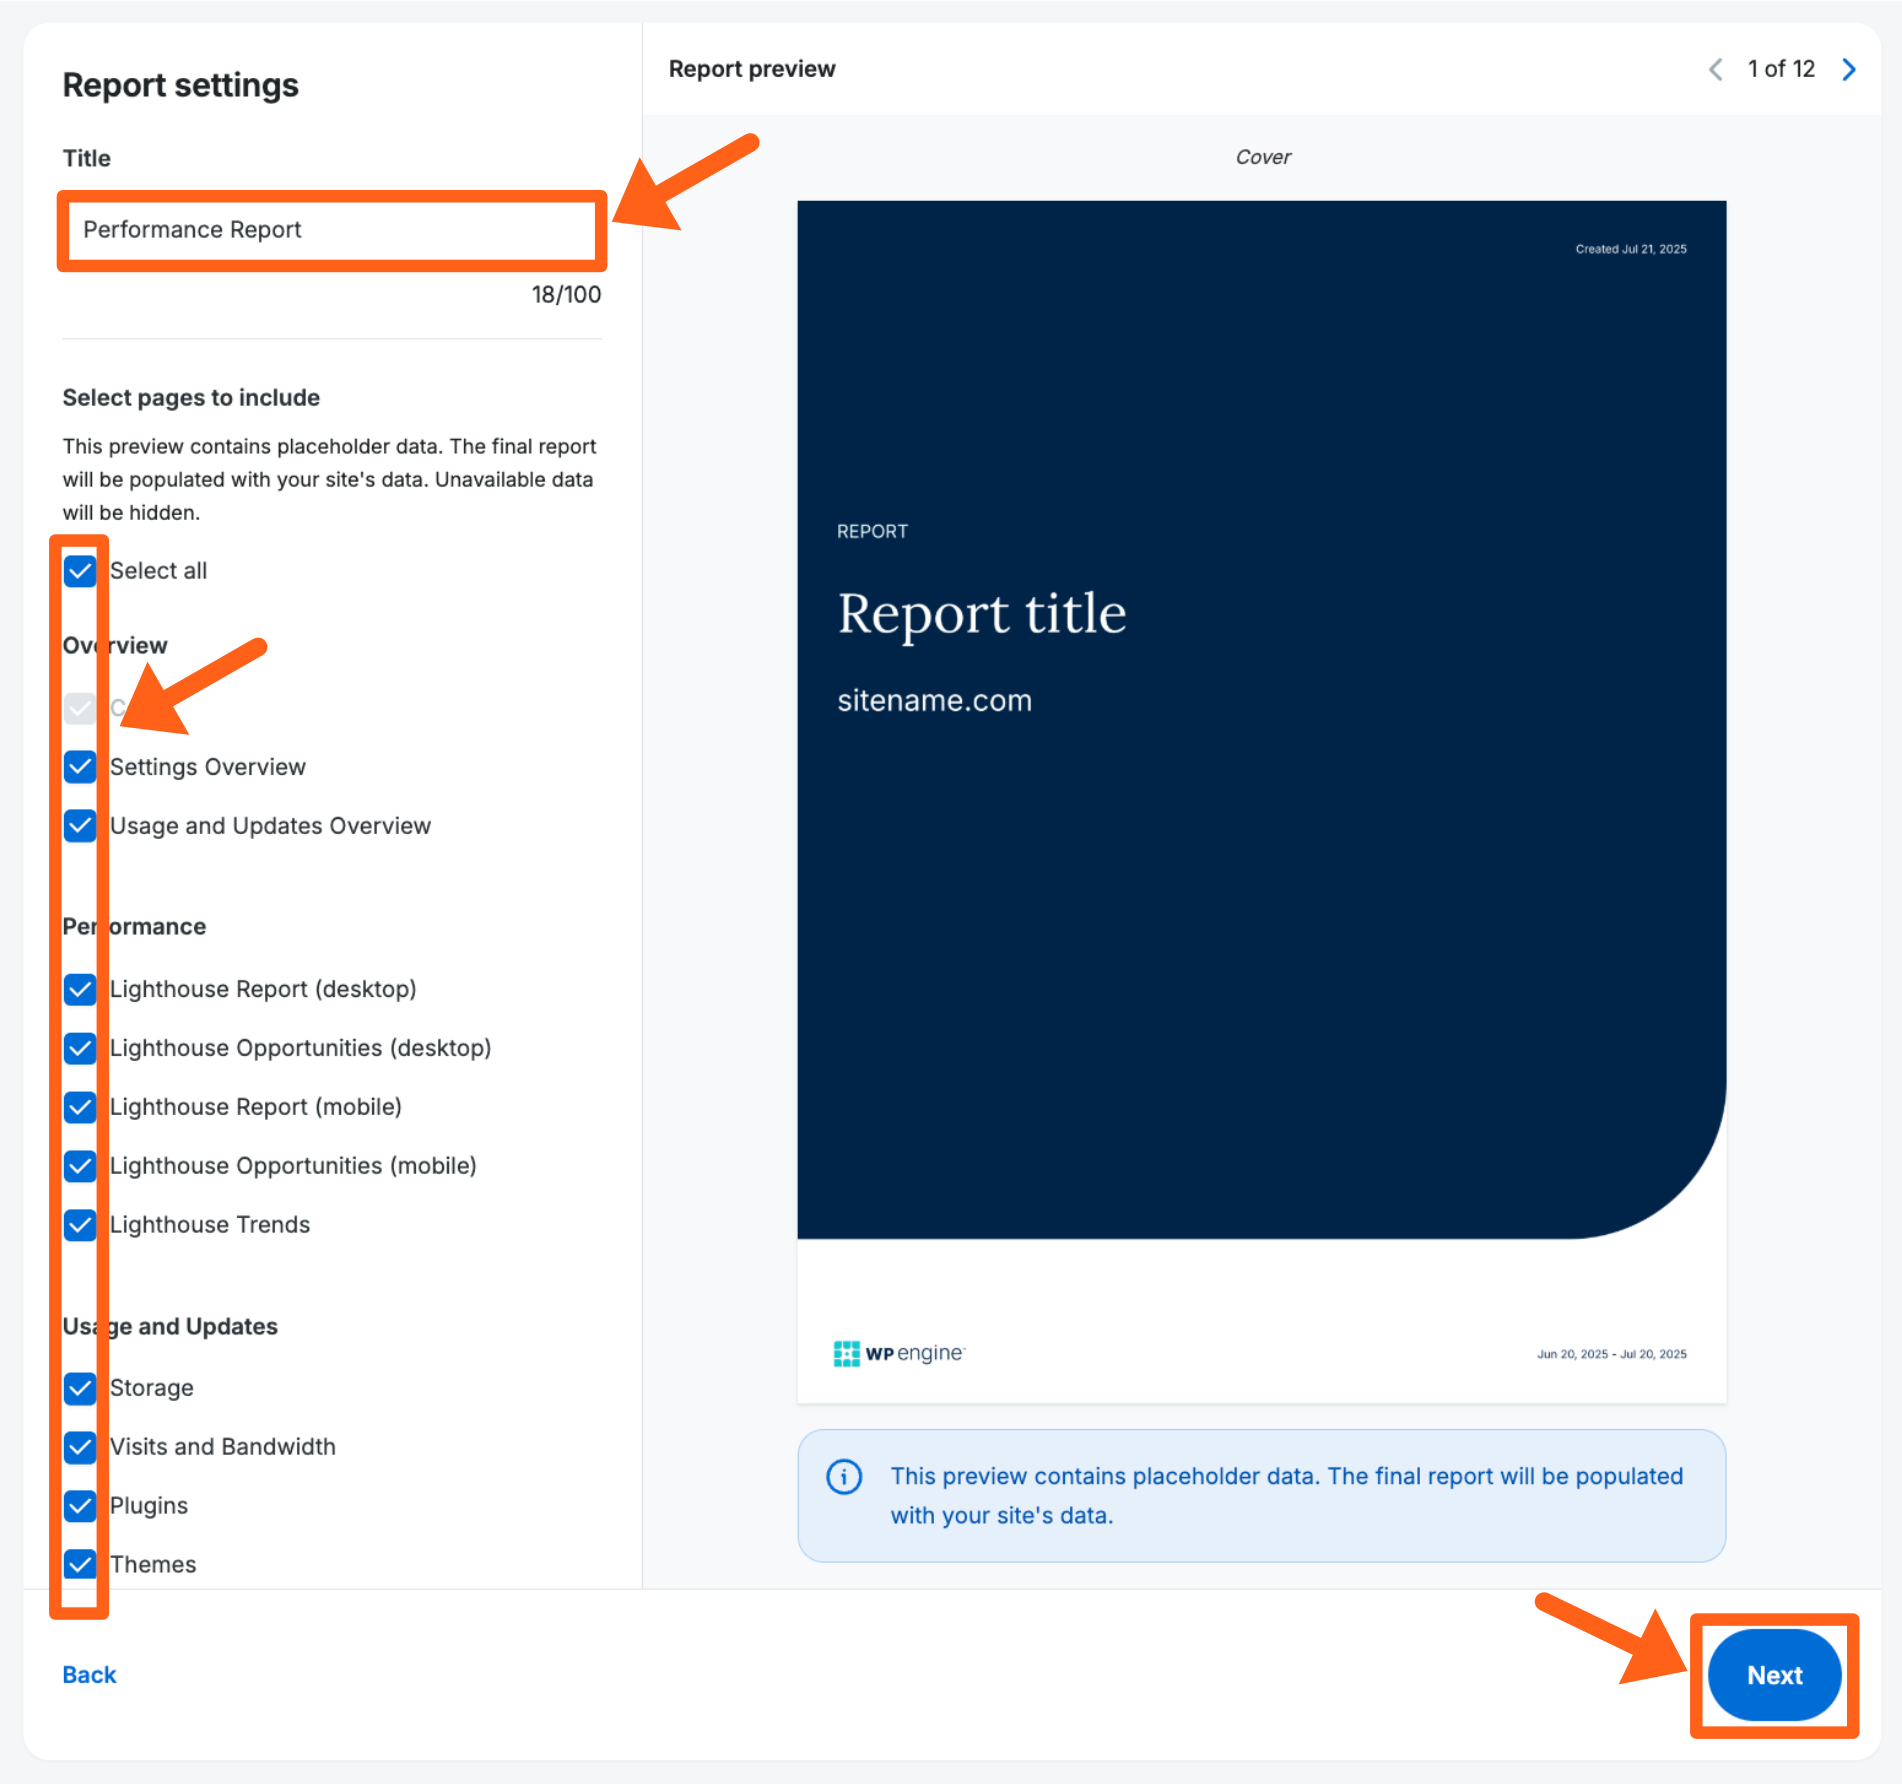
- Give the report a title so you can recognize it when viewing the list of reports to download in the User Portal.
- Check boxes next to each page that you want to include in the report.
- Use the pagination arrows in the top right to see previews of each page with sample content. The preview content is generic just to give you an idea of what type of content will be on the page, and is NOT the content that will be shown in the actual report.
- Click Create report in the bottom right.
- Wait for the report generation to complete. The report will be created in real-time, so please stay on the page until this process completes. This should take less than a minute. If you navigate away from the page before the report is created, the process won’t complete and your report will not be created.
- Download the report. When your report is ready, you’ll be redirected to the main Reports page and your report will appear at the top of the table of reports. Click the download link to download your report.

Report Contents
Review below for more information and previews of all of the report content options that you can select to include in your report:
Settings Overview

The settings overview shows information such as:
- Account name
- Site name
- Production environment
- Information about important features and settings like, DNS network, SSL, caching options, etc.
Usage and Updates Overview

The usage and updates overview shows information about:
- Updates for plugins, themes, WordPress core, and PHP.
- Billable visits
- Storage
- Bandwidth
Lighthouse Reports (mobile & desktop)

The Lighthouse reports show scores of the 4 Lighthouse metrics categories, and useful speed test data from the latest Lighthouse report that was run for the site.
Lighthouse Opportunities (mobile & desktop)

Lighthouse opportunities show potential savings in the amount of data transferred, if you make improvements in specific key areas.
Lighthouse Trends

Lighthouse trends show you a graph of scores for the 4 Lighthouse metrics, across your most recent Lighthouse reports so you can be aware of any drastic score changes.
Storage

View numbers for total, file, and database storage amounts, along with a graph to show total storage changes over time.
Visits and Bandwidth

View totals for billable visits and bandwidth. The bandwidth section shows numbers for Origin and CDN. The origin number shows the amount of data that was transferred from your WP Engine server. The CDN number shows the amount of cached data that was transferred from the Cloudflare CDN servers.
Plugins

The plugins page shows version numbers for the plugins, plus active status, and the update status for each plugin.
Themes

The themes page shows version numbers for the themes, plus active status, and the update status for each theme.
Branding
The option to add custom branding to your reports is now available for Owner and Full users on WP Engine premium (Core and Enterprise) and agency accounts. You can now specify an accent color, a company name, and a logo.
When custom branding is used, your branding will replace WP Engine branding. This means all WP Engine logos are removed from the report and links to WP Engine’s user Portal will be removed if any of your recipients do not have access to the user Portal.
Coming soon!
We’ll be releasing a new feature to enable you to save and re-use branding and other options with re-usable templates.
To customize the branding for your report:
- Go to the reports menu for an environment and click the Create report button.
- In the Content tab, select all of the pages that you want to show for the report.
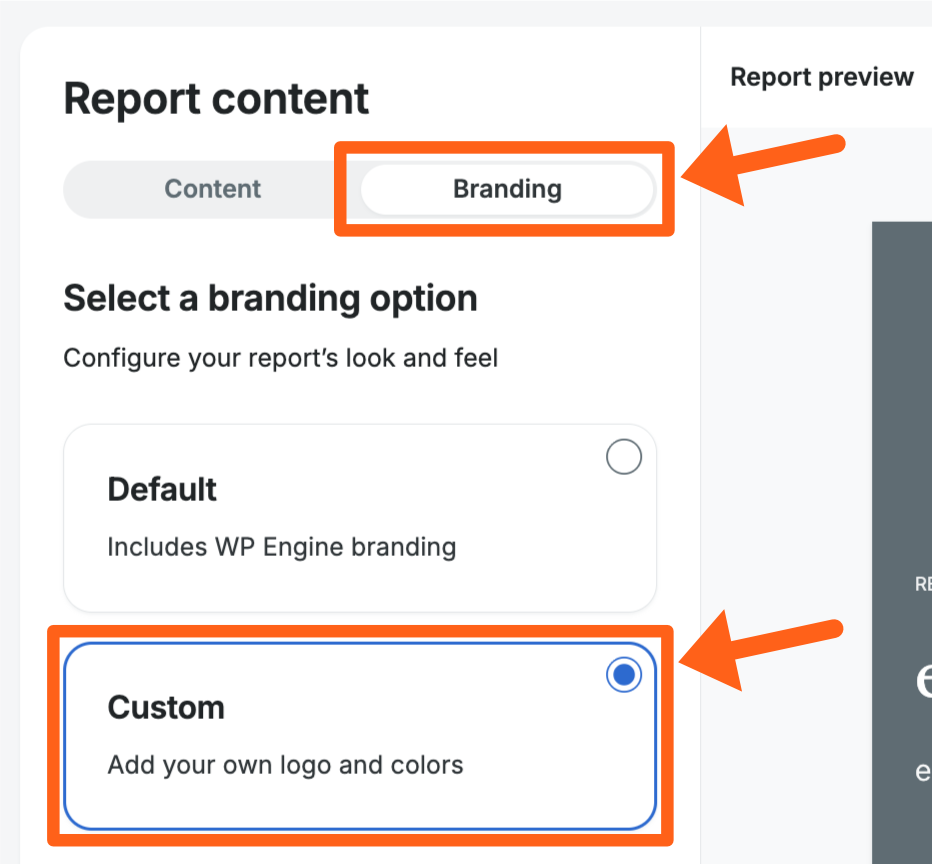
- In the Report content preview, click the Branding tab.
- Select Custom for the branding option.
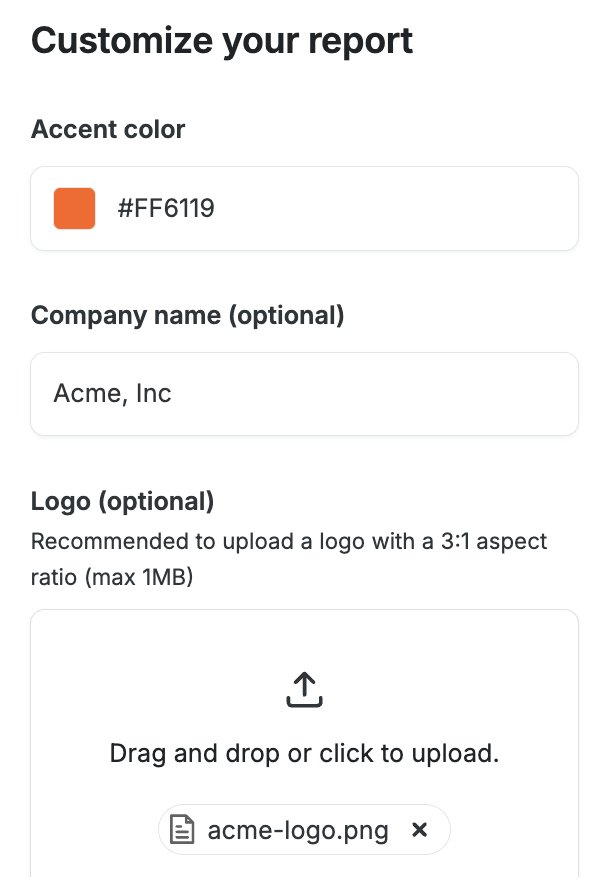
- Add your custom branding options in the Customize your report section.
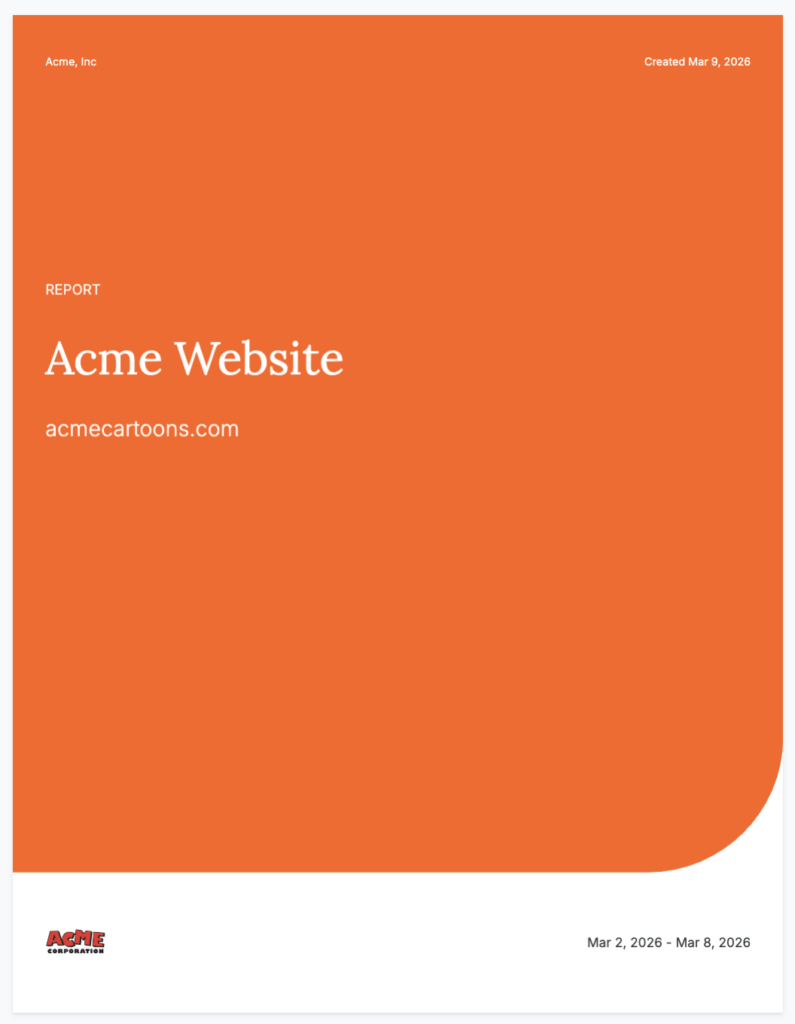
- Accent color: Input a HEX color for the accent color of your report. This color will be used as the background color for the coversheet.
- Company name: Add the name of your company. The text entered here will appear in the upper left part of the coversheet.
- Logo: Add your company logo. This image will appear on the coversheet in the lower left corner and also in the header on all other report pages.
- Supported image types are: JPG, PNG and GIF.
- Max upload size is 1MB.
- Click the Next button and complete the steps to finish scheduling your report.
Schedule Reports
If you want to have reports delivered to your team on a regular basis, you can use our scheduled reports feature and schedule up to 3 different reports per environment. In addition, you can run additional one-time reports up to 2 times every 12 hours.
Note
Only Owner and Full users can schedule a report. Partial users may only run one-time reports.
To schedule a report:
- Click the Create report button on the main Reports page for an environment.
- Give your report a Title, select Pages to include, and then click the Next button.
- Select Schedule a recurring report.
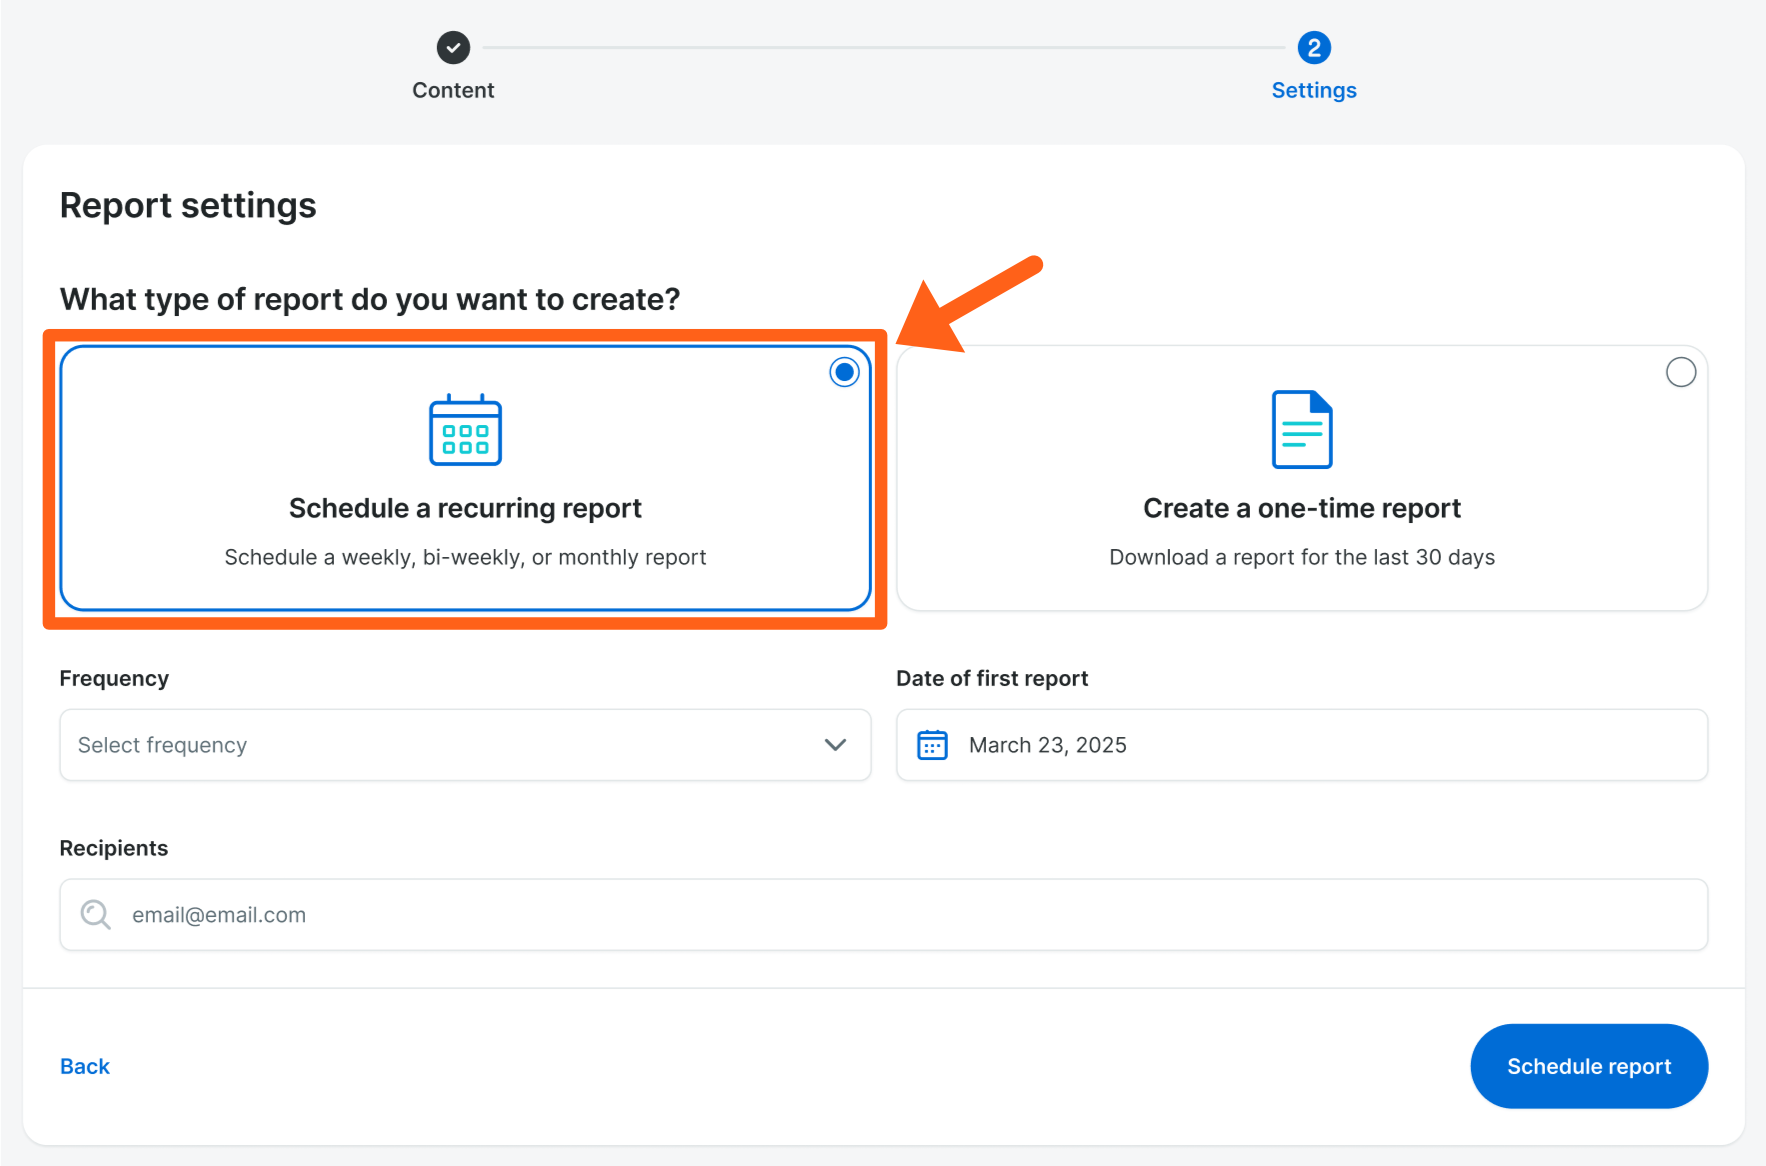
- Set your scheduling settings:
- Frequency: You can choose to run a report weekly, every two weeks or monthly. Monthly reports will include data for the past 30 days, but will be run once per month on the date selected.

- Date of first report: This is the first time your report will be run and sent out. The date you choose will determine when future reports are scheduled.
- Weekly: These will be sent out on whichever day of the week your chosen date was on. For example, if you select a date that falls on a Tuesday, your report will be sent out every Tuesday.
- Every two weeks: These will be sent out on whichever day of the week your chosen date was on. For example, if you select a date that falls on a Tuesday, your report will be sent out every other Tuesday.
- Monthly: These will be sent out whichever day of the month you selected. For example, if you select the 2nd of the month, then your report will be sent out every month on the 2nd.
Note: If you select a date towards the end of the month, then in shorter months the report will be sent out on the last day of the month. For example, if your first report is scheduled to go out on January 31st, then in February, the report will be sent out on the 28th (or 29th in a leap year).
- Recipients: You can select up to 20 people to receive this report.
Users on our Agency and Premium plans will also have the option of adding users who don’t have access to WP Engine’s User Portal as report recipients.
Note: If you add a non account user email address, you’ll then need to hit TAB or Enter, and then check the confirmation checkbox to confirm that you want to send the report to a non-user.
- Frequency: You can choose to run a report weekly, every two weeks or monthly. Monthly reports will include data for the past 30 days, but will be run once per month on the date selected.
- Click the Schedule report button.
Note
We’ll be adding the ability to white label our Site Report in early 2026. This feature will be available to users on our Agency and Premium plans.
Scheduled Reports Overview
Once you’ve created a scheduled report, it will appear at the top of the Reports page. Each scheduled report’s card displays a summary of the report schedule. Clicking on the recipients link will display a list of who’s receiving the report each time it goes out. Clicking on the 3 dot menu will give you the option to Delete or Edit a scheduled report.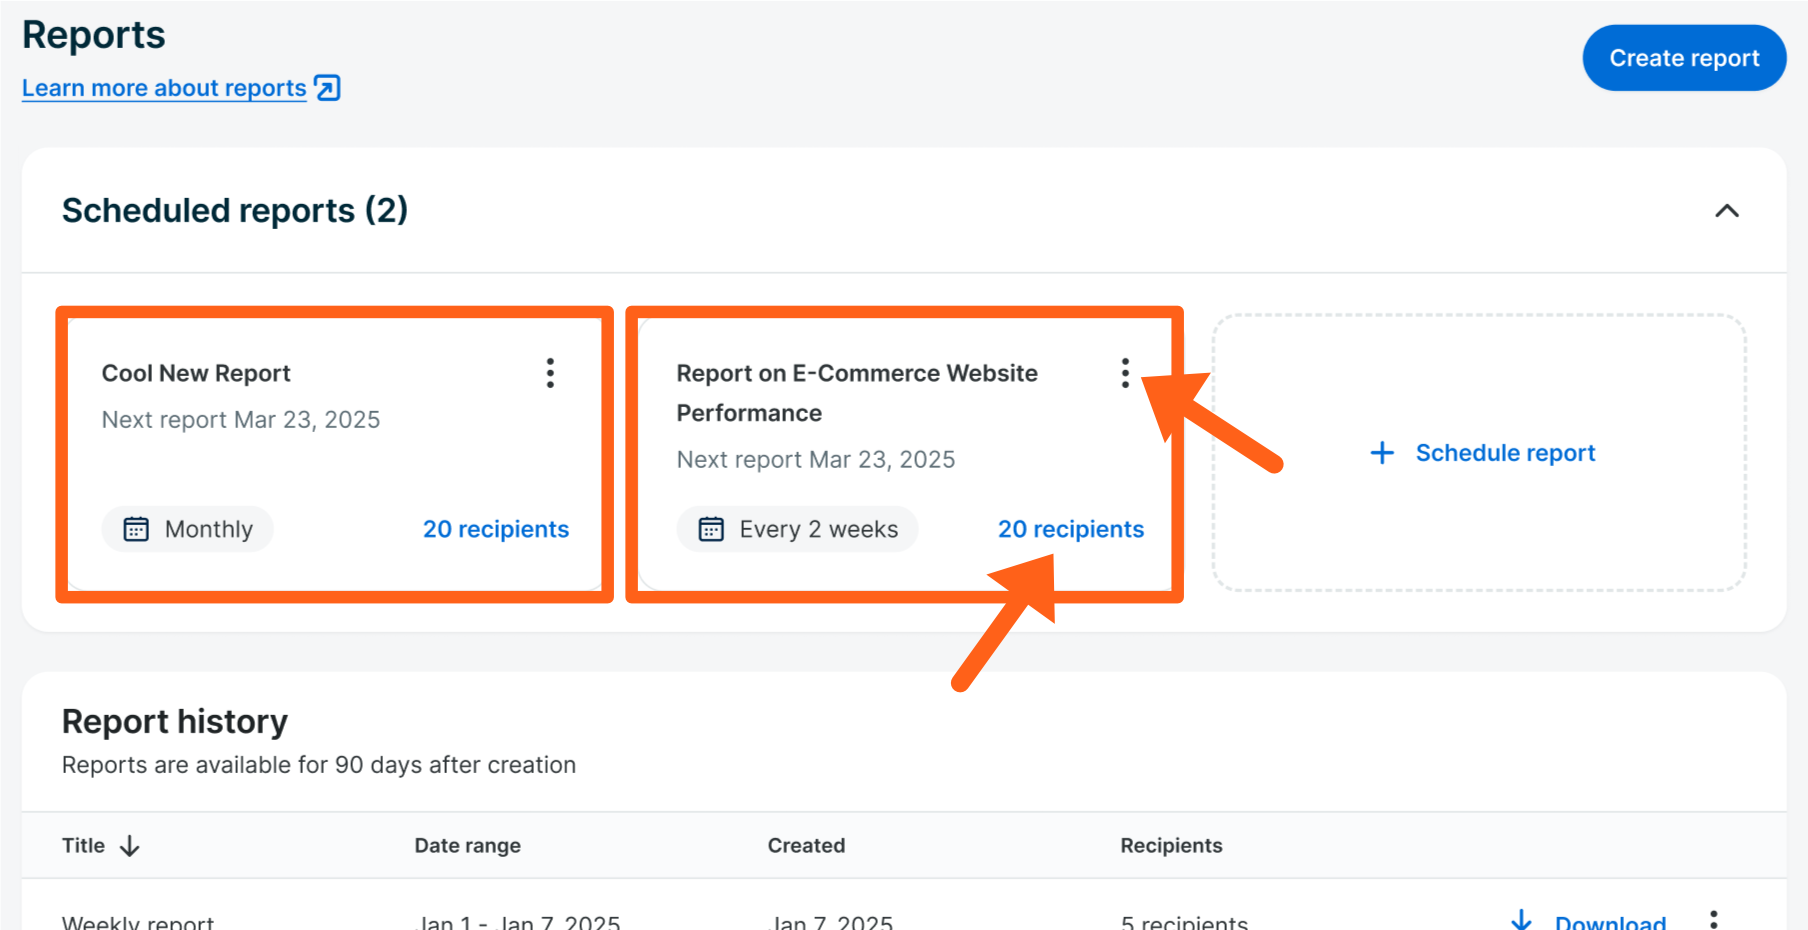
Edit a Scheduled Report
After a Site Report schedule has been created, it can be edited by Owner and Full users.
To edit a Site Report, simply click on the three dot menu icon in the top right of the card for a report under Scheduled reports and select Edit. You’ll have the option to update the pages included in the report as well as the frequency, recipients and schedule date for the report.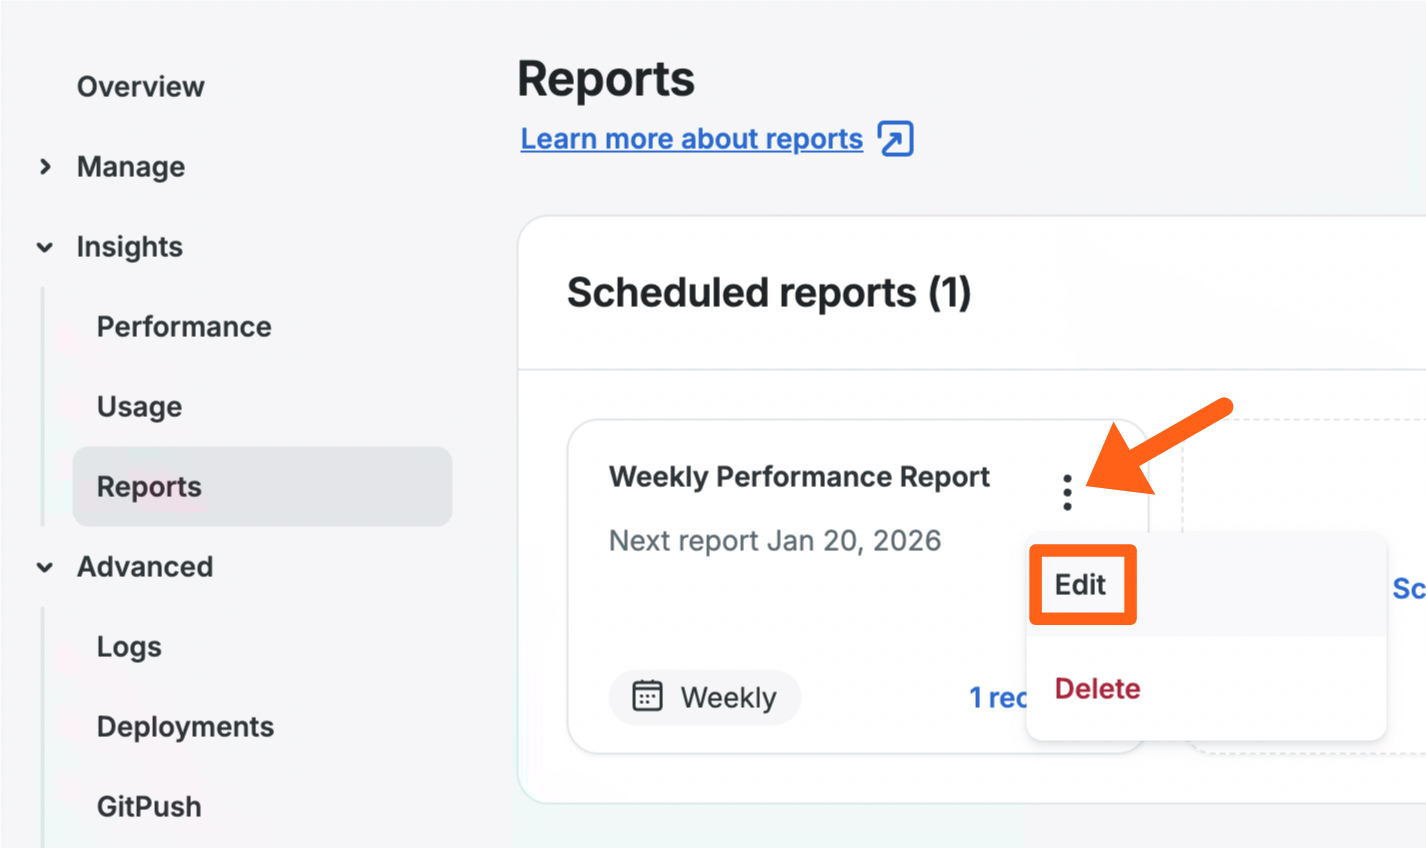
View Past Reports
After a report is created, it remains accessible on the main Reports page for at least 30 days.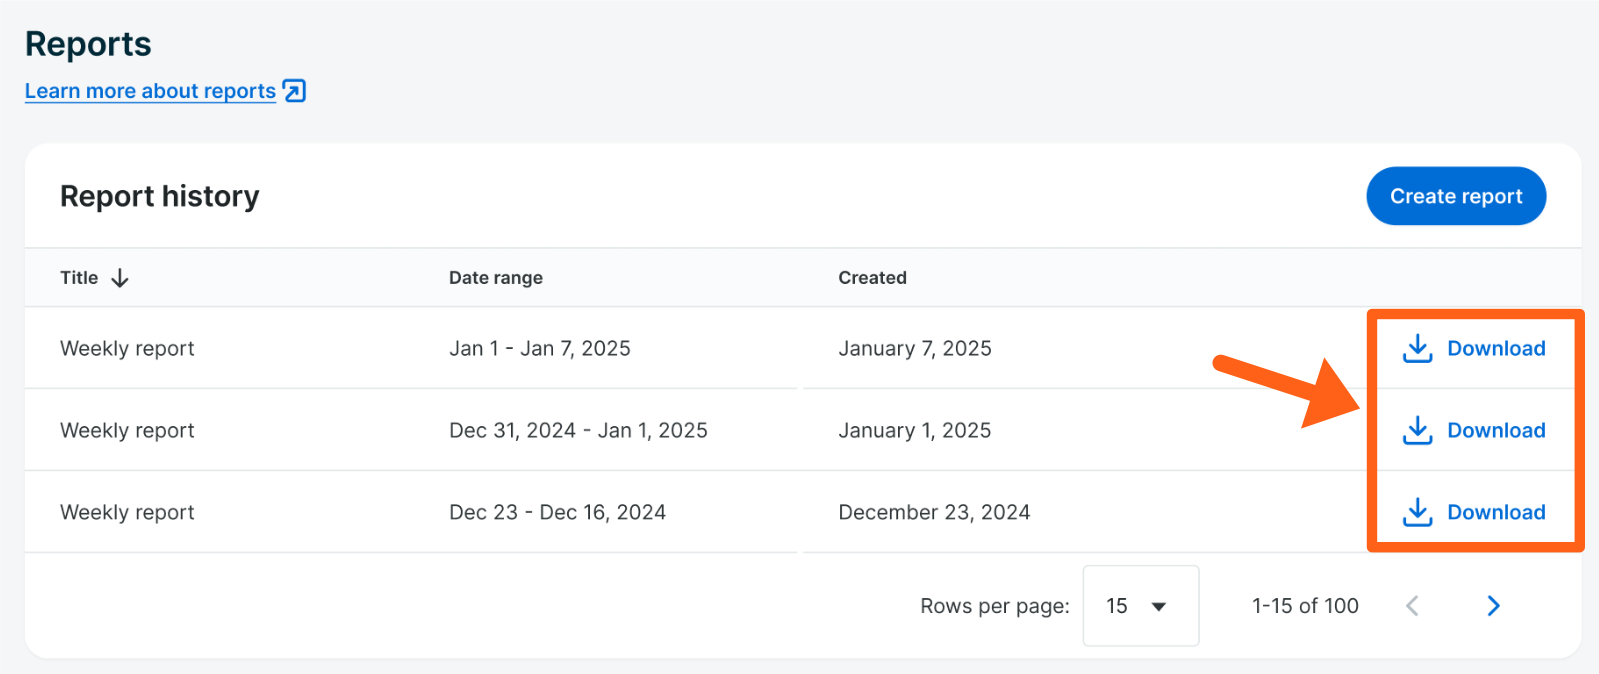
Account Level Site Reports Page
The account level site reports page lets you see all of the reports that you have scheduled for each environment of the currently selected account. You’ll have the option to edit or delete reports, and to create reports.
To see the account level site reports page go to Insights > Reports in the main left sidebar of the User Portal.