WP Engine Analytics powered by TWIPLA
WP Engine Analytics is a platform that gives you valuable insights about your visitors’ journey through your website and is powered by TWIPLA (The Website Intelligence Platform). Many of the main features are summarized below with links to view the documentation for each.
WP Engine Analytics is available as part of our Newsroom package.
Read more about Newsroom here.
Access WP Engine Analytics
Once you have signed up for Newsroom, you can go to the Products page and select Analytics in the “Manage your products” section.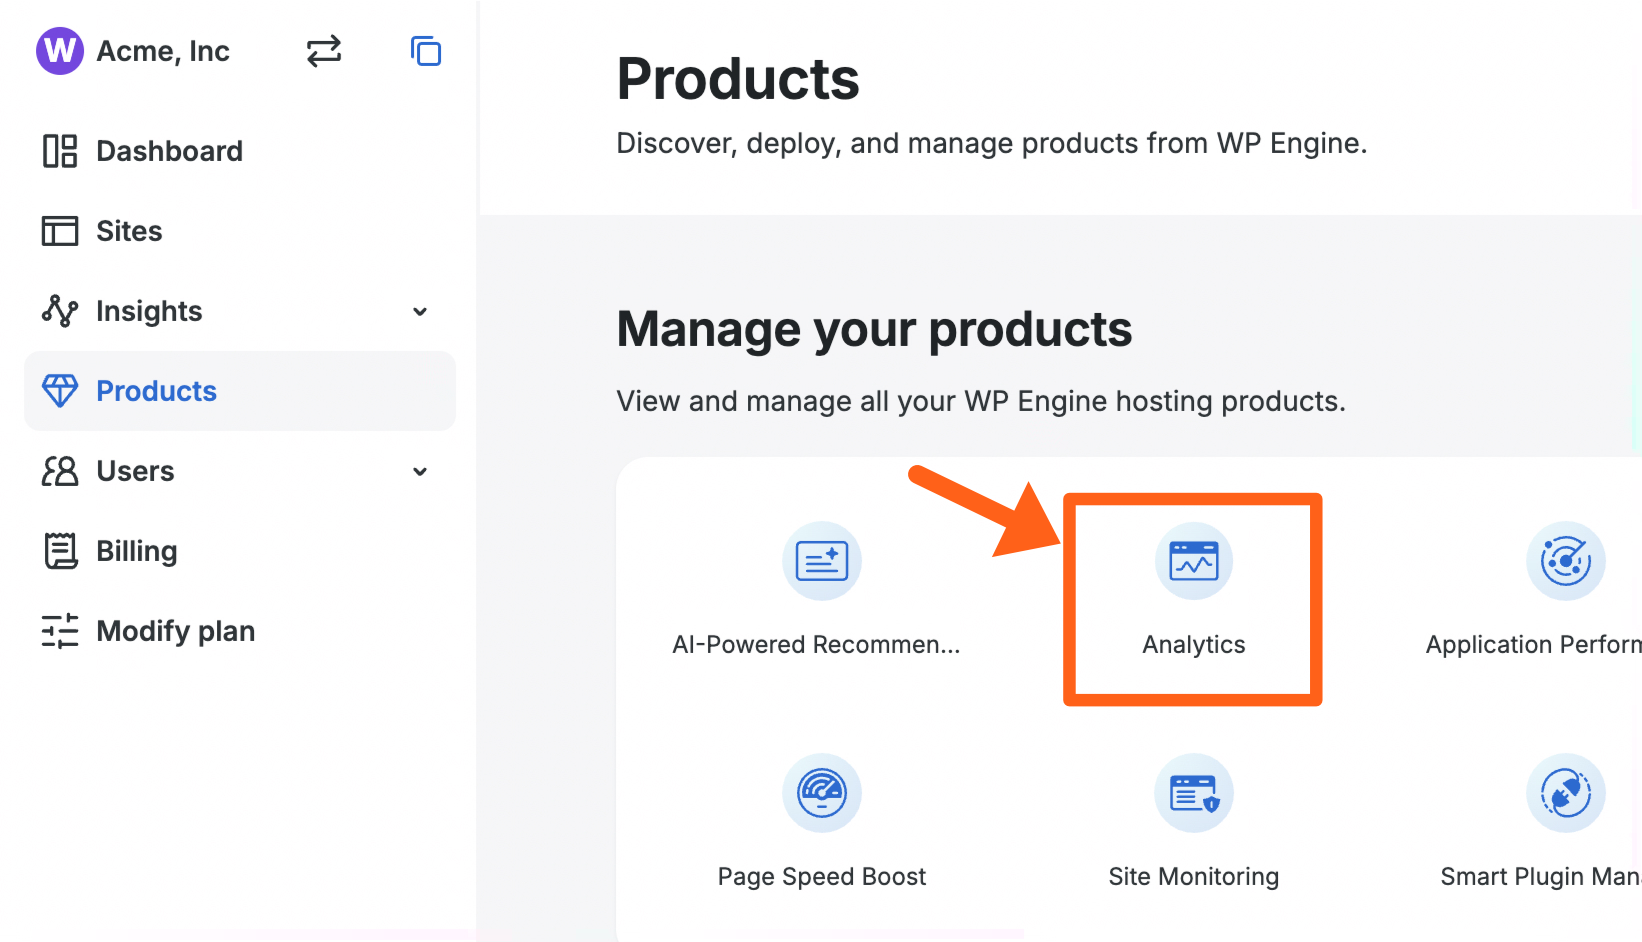
From the Analytics page, you can click the + Add environment button to apply an analytics license to an environment on your Newsroom site.
Once a license has been added you’ll see the environment in the table on the Analytics page and you can click the View analytics link next to the environment name to access the analytics dashboard.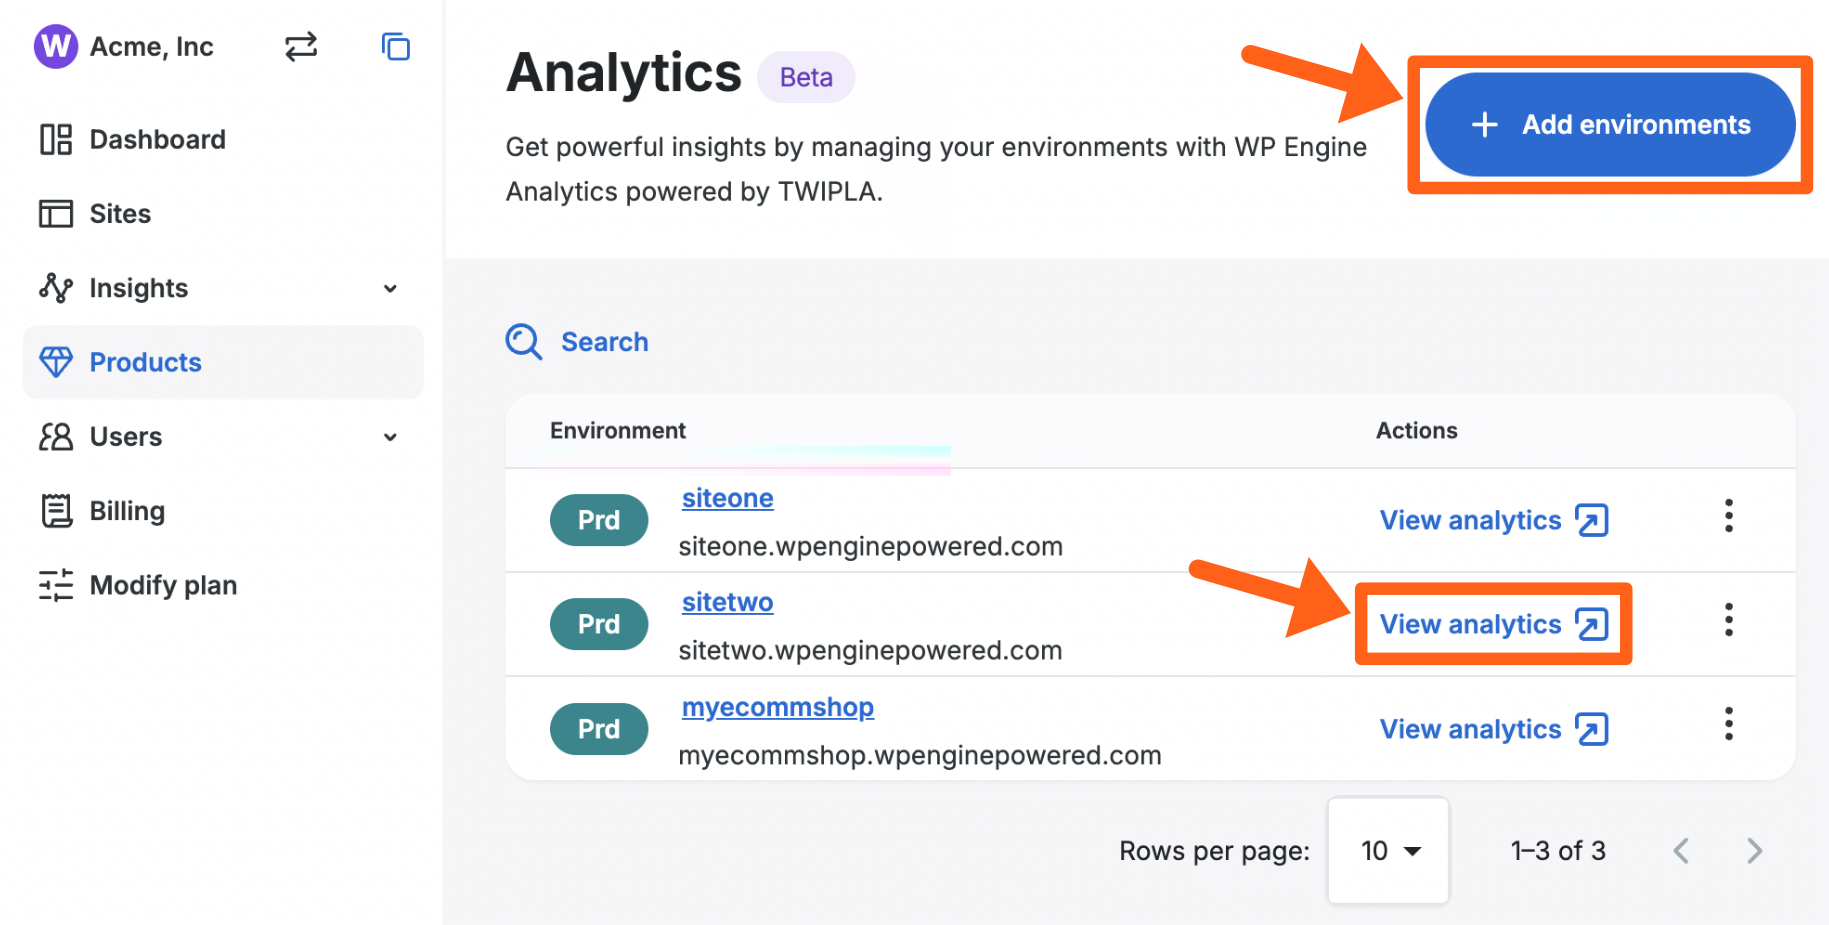
Custom Dashboards
The Main Dashboards feature offers different dashboards (Master, Pages, and Custom) to quickly gather and visualize essential information about your website’s performance, allowing you to apply filters and visitor segments for focused data analysis. The key functionality is the ability to create new custom dashboards and add report blocks tailored precisely to your preferences and specific analytical needs.
Read more about adding custom dashboards.
Create a new dashboard by going to Main Dashboard > Create New Dashboard, in the analytics dashboard.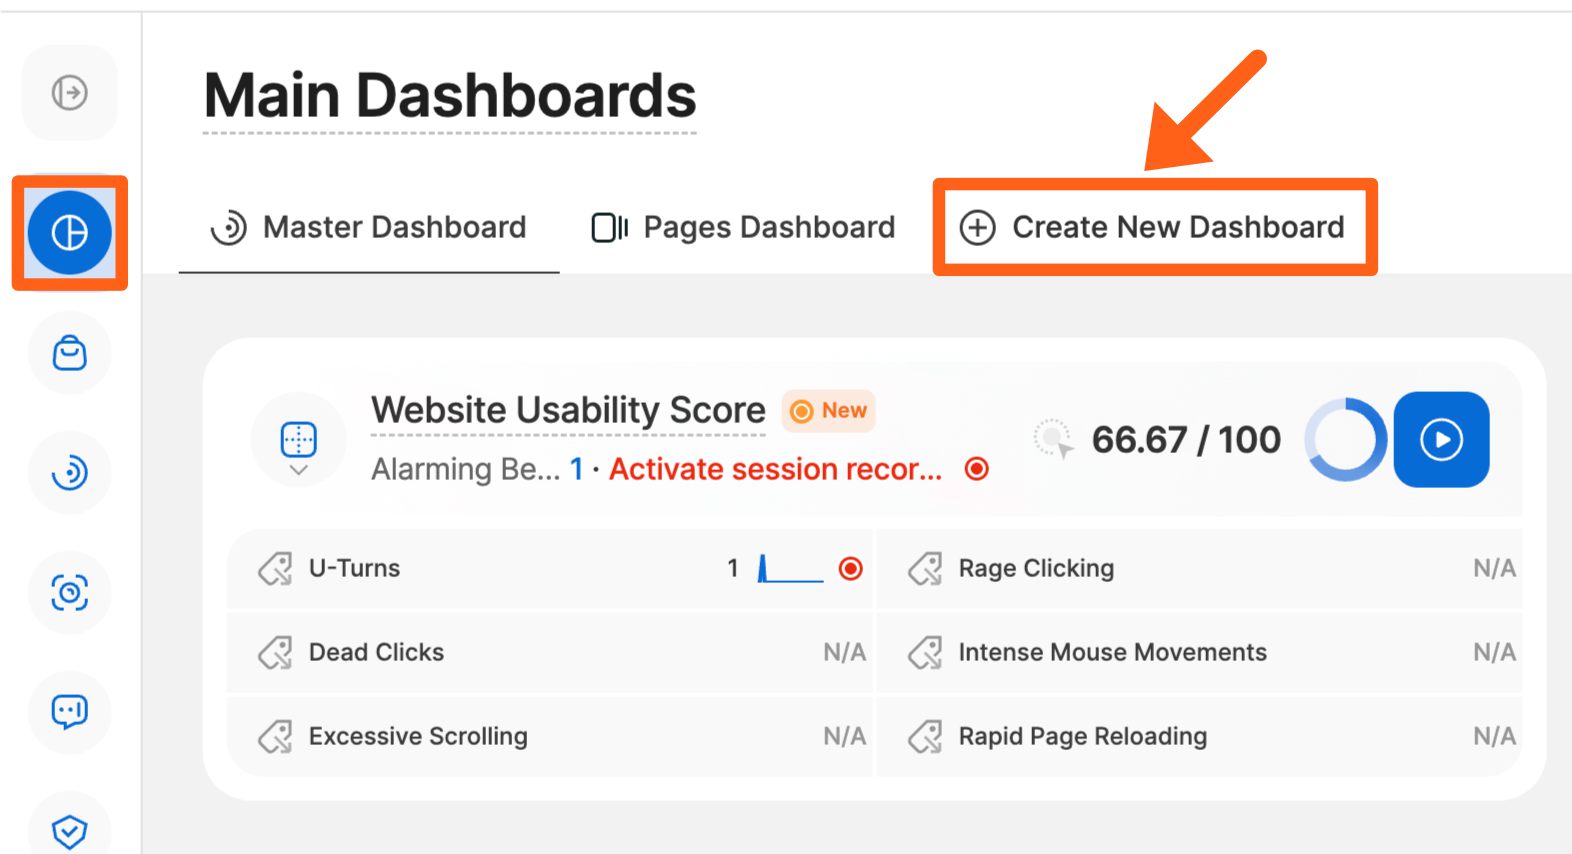
Heatmaps
Page Heatmaps visualize user behavior through a color coded representation of interactions on your website, revealing the most engaging areas. They show the exact spots that receive the most clicks (on desktop) and taps (on mobile/tablet), where the mouse is moved most frequently, and the average scroll rate for a specific page. Unlike session recordings which focus on single user sessions, heatmaps aggregate data based on up to 8,000 views of one page.
Read more about how to use heatmaps.
View heatmaps by going to Visitor Behavior > Page Heatmaps, in the analytics dashboard.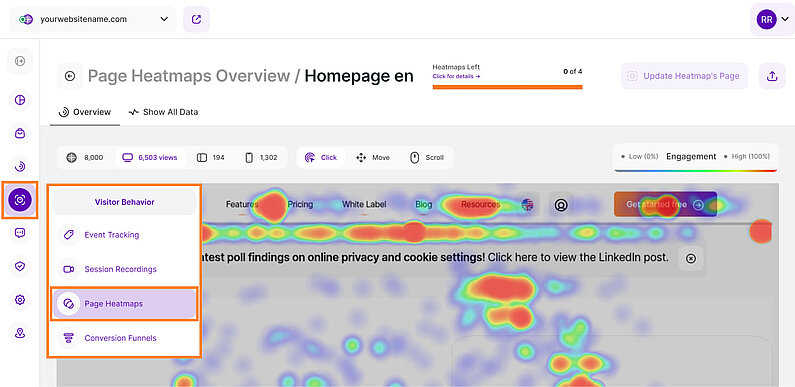
Event Tracking
Event Tracking captures both automatically tracked standard events and manually-defined custom events, allowing you to monitor precisely how often visitors trigger specific actions on your website over time. This feature provides a detailed overview of all tracked events, a line diagram visualization, and the ability to create custom event tags to measure unique visitor interactions.
Read more about event tracking.
View events by going to Visitor Behavior > Event Tracking, in the analytics dashboard.![]()
Session Recording
The Session Recordings feature captures video-like replays of visitor sessions, enabling you to visually see all actions, including clicks, scrolling, and content viewing patterns, exactly as the visitor experienced them. Analyzing these recordings helps to identify how visitors interact with your website, allowing for a thorough understanding of user journeys and for optimizing the site for a better overall experience.
Read more about session recordings.
View sessions by going to Visitor Behavior > Session Recordings, in the analytics dashboard.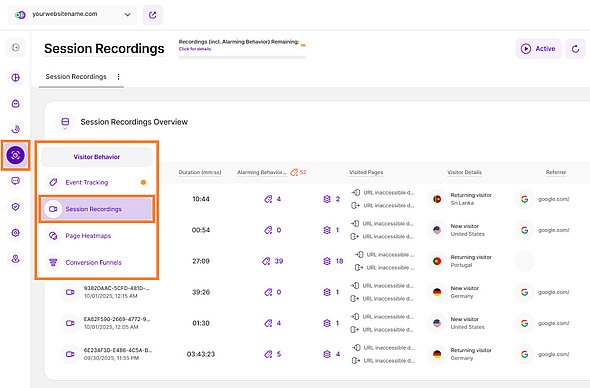
Conversion Funnels
Conversion Funnels allow you to map multi-step visitor journeys and measure the drop-off rate between defined stages, with a session counting as converted if the steps are completed in the correct order. You can define funnel levels based on criteria like page visits or event triggers (including e-commerce and alarming behavior), and for any session that drops out, you can view the corresponding recording to identify the cause.
Read more about conversion funnels.
View conversions by going to Visitor Behavior > Conversion Funnels, in the analytics dashboard.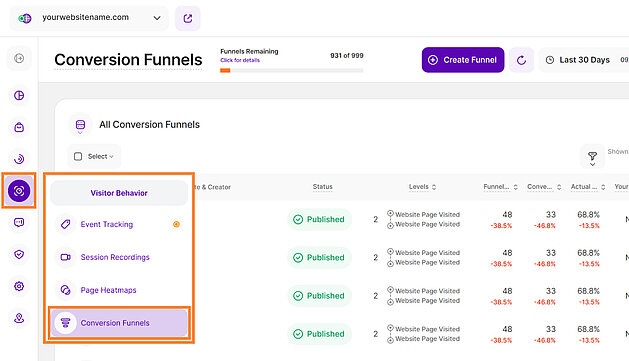
UTM Campaigns
The UTM Campaigns feature provides a quick overview of key data from your campaigns, automatically recognizing UTM parameters when a visitor uses a UTM link that you’ve set up elsewhere. It is divided into five sections: Overview, All UTM Campaign Visitors, My UTM Campaigns, Campaign Charts, and a URL Builder. This allows you to view data by custom filters like source, medium, and term to assess campaign effectiveness.
Read more about viewing UTM statistics.
View UTM campaigns by going to Web Statistics > UTM Campaigns, in the analytics dashboard.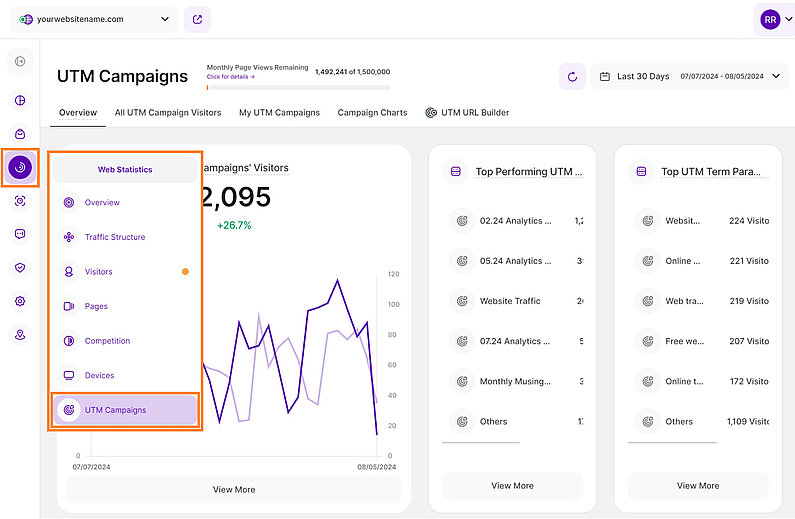
Devices
The Devices submodule offers a comprehensive overview of the devices (mobile, tablet, desktop), operating systems, browsers, and screen resolutions visitors use to access your website. This data is crucial for tailoring your content and responsive design to the devices your audience uses most, with filtering capabilities for precise analysis and optimization.
Read more about device statistics.
View Devices by going to Web Statistics > Devices, in the analytics dashboard.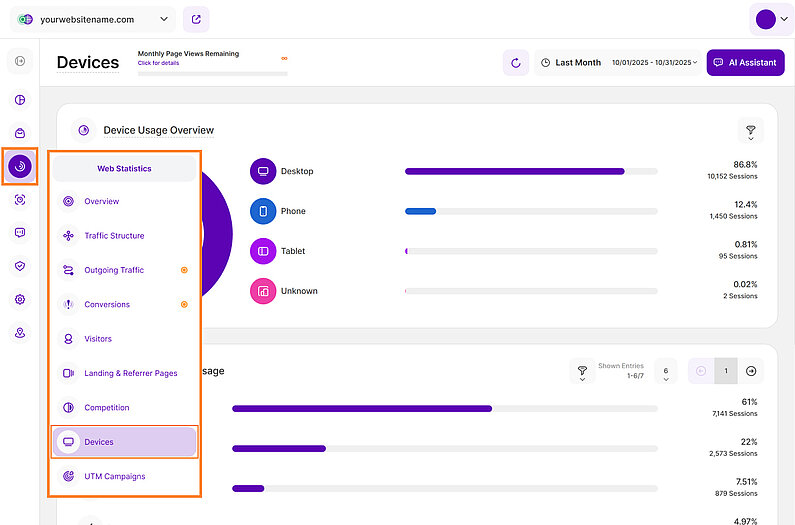
Competition Analysis
The Competition submodule allows you to compare your website’s performance data, such as visitors, page views, and device usage, against the respective averages of competing websites in a self-selected region and business sector. After defining your own site’s and competitors’ sectors, the platform calculates average metric values from its database, providing a visual comparison to help you identify areas for improvement.
Read more about competition analysis.
View competition analysis by going to Web Statistics > Competition, in the analytics dashboard.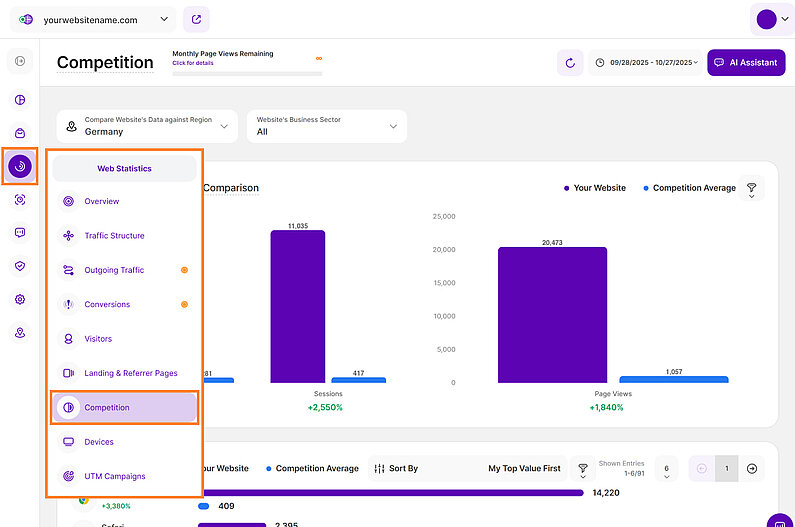
Visitor Communication
The Visitor Communication feature enables you to collect direct, real feedback from your audience by creating on-site “question bubbles” (Polls) or complex questionnaires on a separate URL (Surveys). This priceless feature complements numerical statistics by allowing you to ask direct questions about service satisfaction or navigation ease and easily evaluate hundreds or thousands of replies to improve your website.
Read more about visitor communication.
View visitor communication by going to Visitor Communication and then selecting either Polls or Surveys, in the analytics dashboard.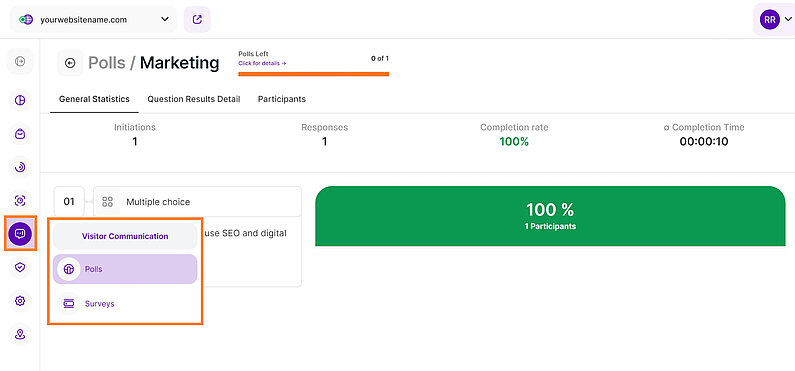
Landing Pages
The Landing & Referrer Pages module details the entry points to your website, showing which pages visitors start their sessions on and what external sources (referrers) are driving traffic. It is split into three sections: Landing Pages, Referring Sites, and Internal URL Referrers. This data can help you understand visitor journeys, gauge the relative contribution of each landing page, and refine your content strategy based on traffic origins.
Read more about landing page and referrer statistics.
View landing and referrer pages by going to Web Statistics > Landing & Referrer Pages, in the analytics dashboard.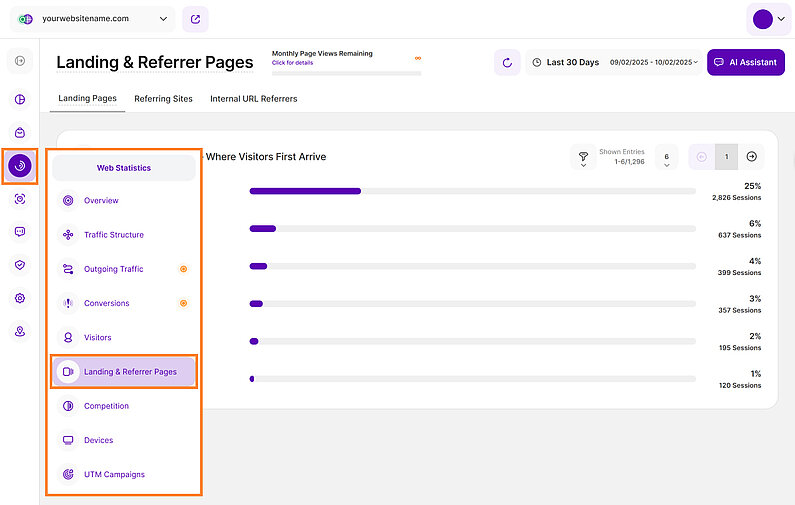
Privacy Center
The Privacy Center provides complete control over your website’s data privacy settings, allowing you to choose from four levels of privacy, from Light to Maximum Privacy (default). This feature ensures compliance with various regulations by controlling the anonymization of information like IP addresses and page history, and it also allows for custom country-level data settings.
Read more about privacy settings.
View privacy options by going to Privacy Center, in the analytics dashboard.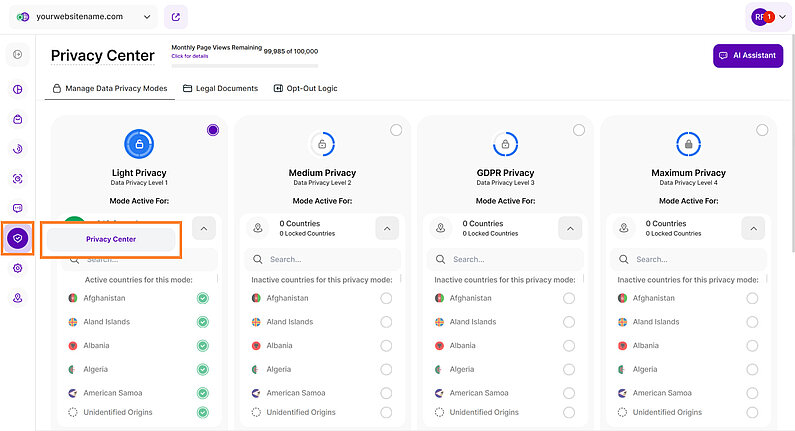
Traffic Structure
The Traffic Structure submodule provides a comprehensive breakdown of your incoming website traffic, helping you determine which channels (e.g. Direct, Social Media, Organic Search) bring the most visitors. It allows for in-depth analysis of key performance indicators like total sessions, pages visited per session, and bounce rate, all segmented by traffic channel to uncover valuable visitor sources.
Read more about viewing your traffic structure.
View traffic structure by going to Web Statistics > Traffic Structure, in the analytics dashboard.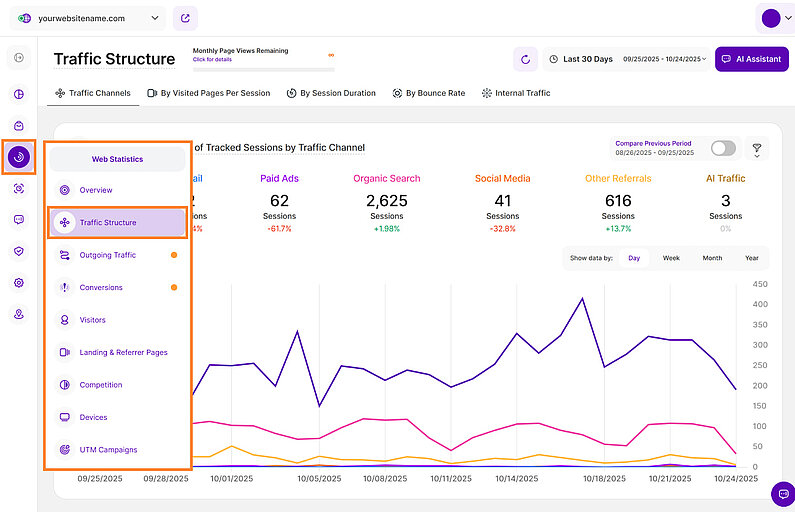
Alarming Behavior Tracking
Alarming Behavior Events Tracking (ABEs) is a set of automatically monitored visitor actions that indicate poor user experience, such as Rage Clicking, Dead Clicks, Excessive Scrolling, and Rapid Page Reloading. This feature identifies these critical behaviors, offers visualization options (line chart or pie chart), and links directly to pre-filtered session recordings, allowing you to pinpoint and fix bugs or design flaws that frustrate visitors.
Read more about alarming behavior tracking.
View alarming behavior by going to Visitor Behavior > Event Tracking, in the analytics dashboard, and then selecting the Alarming Behavior Events tab.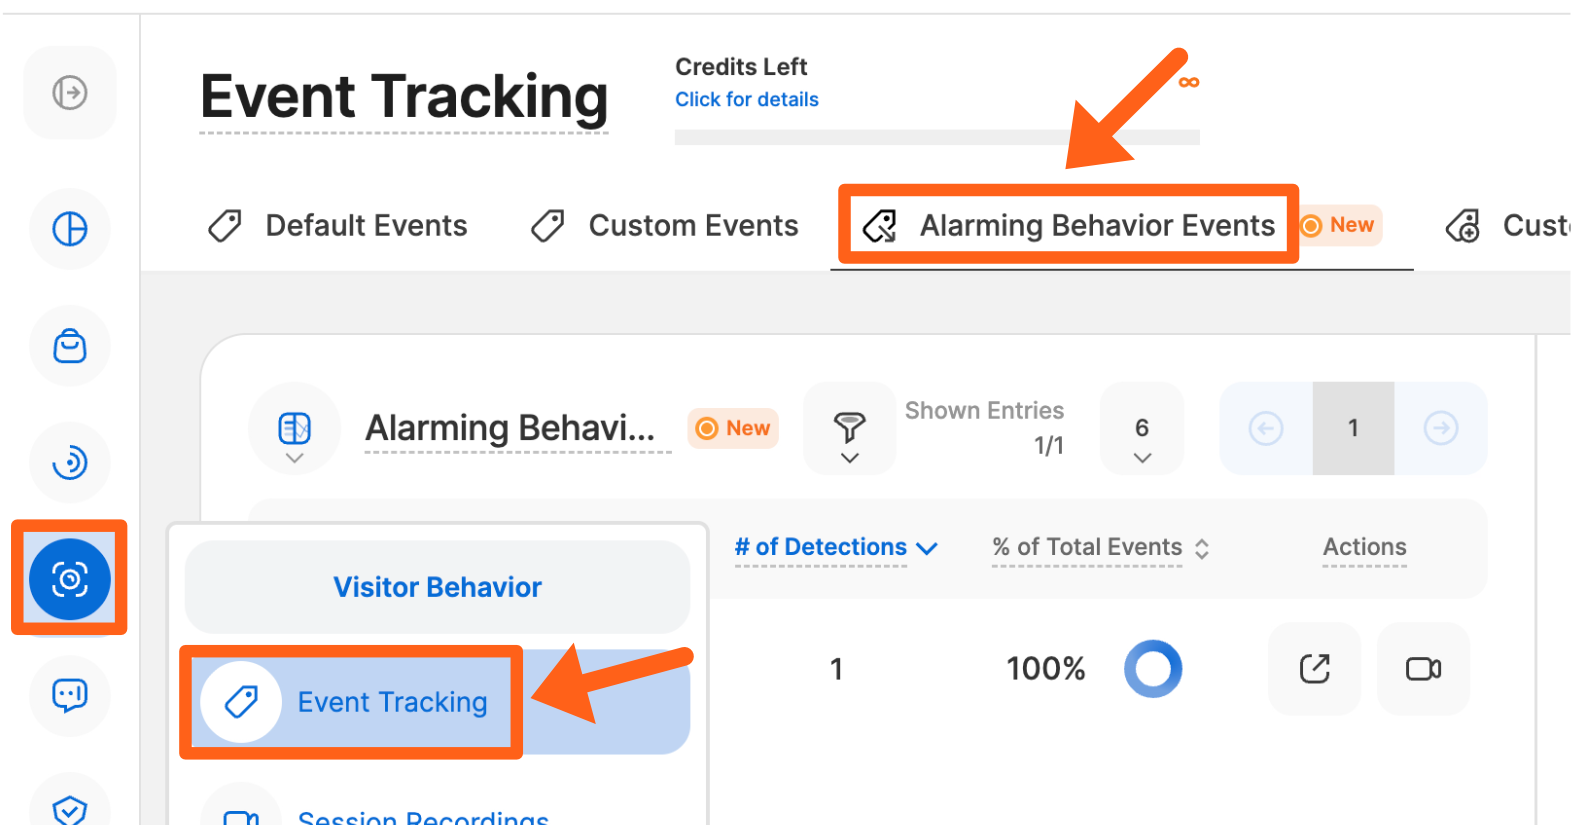
eCommerce Statistics
eCommerce Statistics is a dedicated feature designed to track and guide the success of an online store by providing granular, actionable insights into customer behavior, product popularity, and purchasing trends to boost revenue. It offers key performance indicators like Net Revenue, Average Order Value, and product-specific metrics for most-viewed or most-removed from cart items, and supports integration with various eCommerce events.
Read more about eCommerce statistics.
View eCommerce statistics by going to ECommerce > Overview, in the analytics dashboard.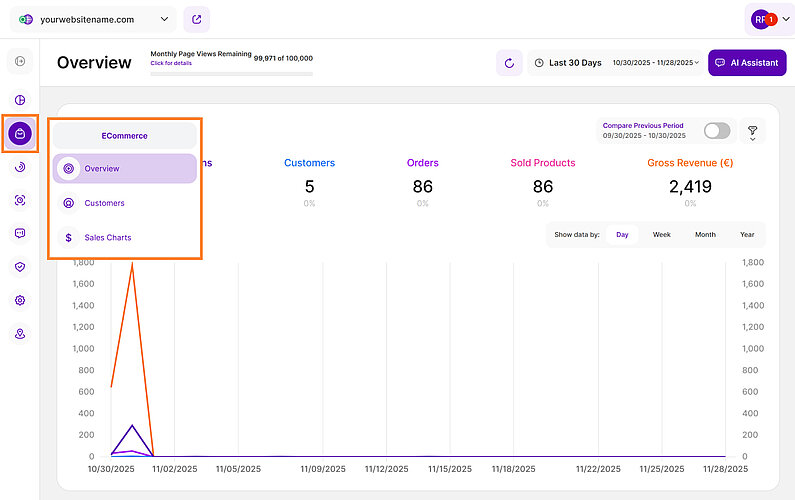
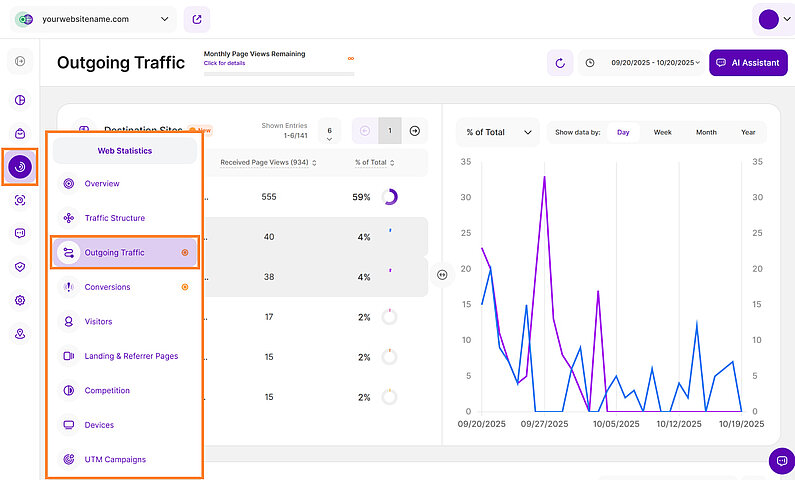
Outgoing Traffic
The Outgoing Traffic feature provides a clear view of where visitors go after leaving your site by clicking on external links. This helps you understand 3rd-party website destinations and the total volume of page views that were forwarded to a 3rd-party website. It offers a table of destination websites and a comparison chart of overall incoming versus outgoing traffic, which can be visualized in various chart types like line and bar diagrams.
Read more about outgoing traffic.
View outgoing traffic by going to Web Statistics > Outgoing Traffic, in the analytics dashboard.