Get Started
Usage Page
Tags:
Key Takeaways
The Usage page helps manage plan resource usage effectively. It provides insights on storage, bandwidth, and visits, aiding in optimizing site performance.
Primary metrics include storage, sites, bandwidth, and billable visits. Regular monitoring of these metrics is crucial for resource management and cost optimization.
Detailed usage reports can be downloaded for in-depth analysis. These reports offer valuable data on account usage trends and help in making informed decisions.
Leaders should ensure regular monitoring of usage metrics to optimize resource allocation and performance.
The Usage page is available to WP Engine customers and is designed to help better view and manage plan resource usage.
Access Usage Page
Usage can be accessed in the WP Engine User Portal by Owners and Full (with Billing) users.
- From the User Portal, expand Insights in the main sidebar
- Select Usage
- The Usage page can be accessed directly at: https://my.wpengine.com/usage/
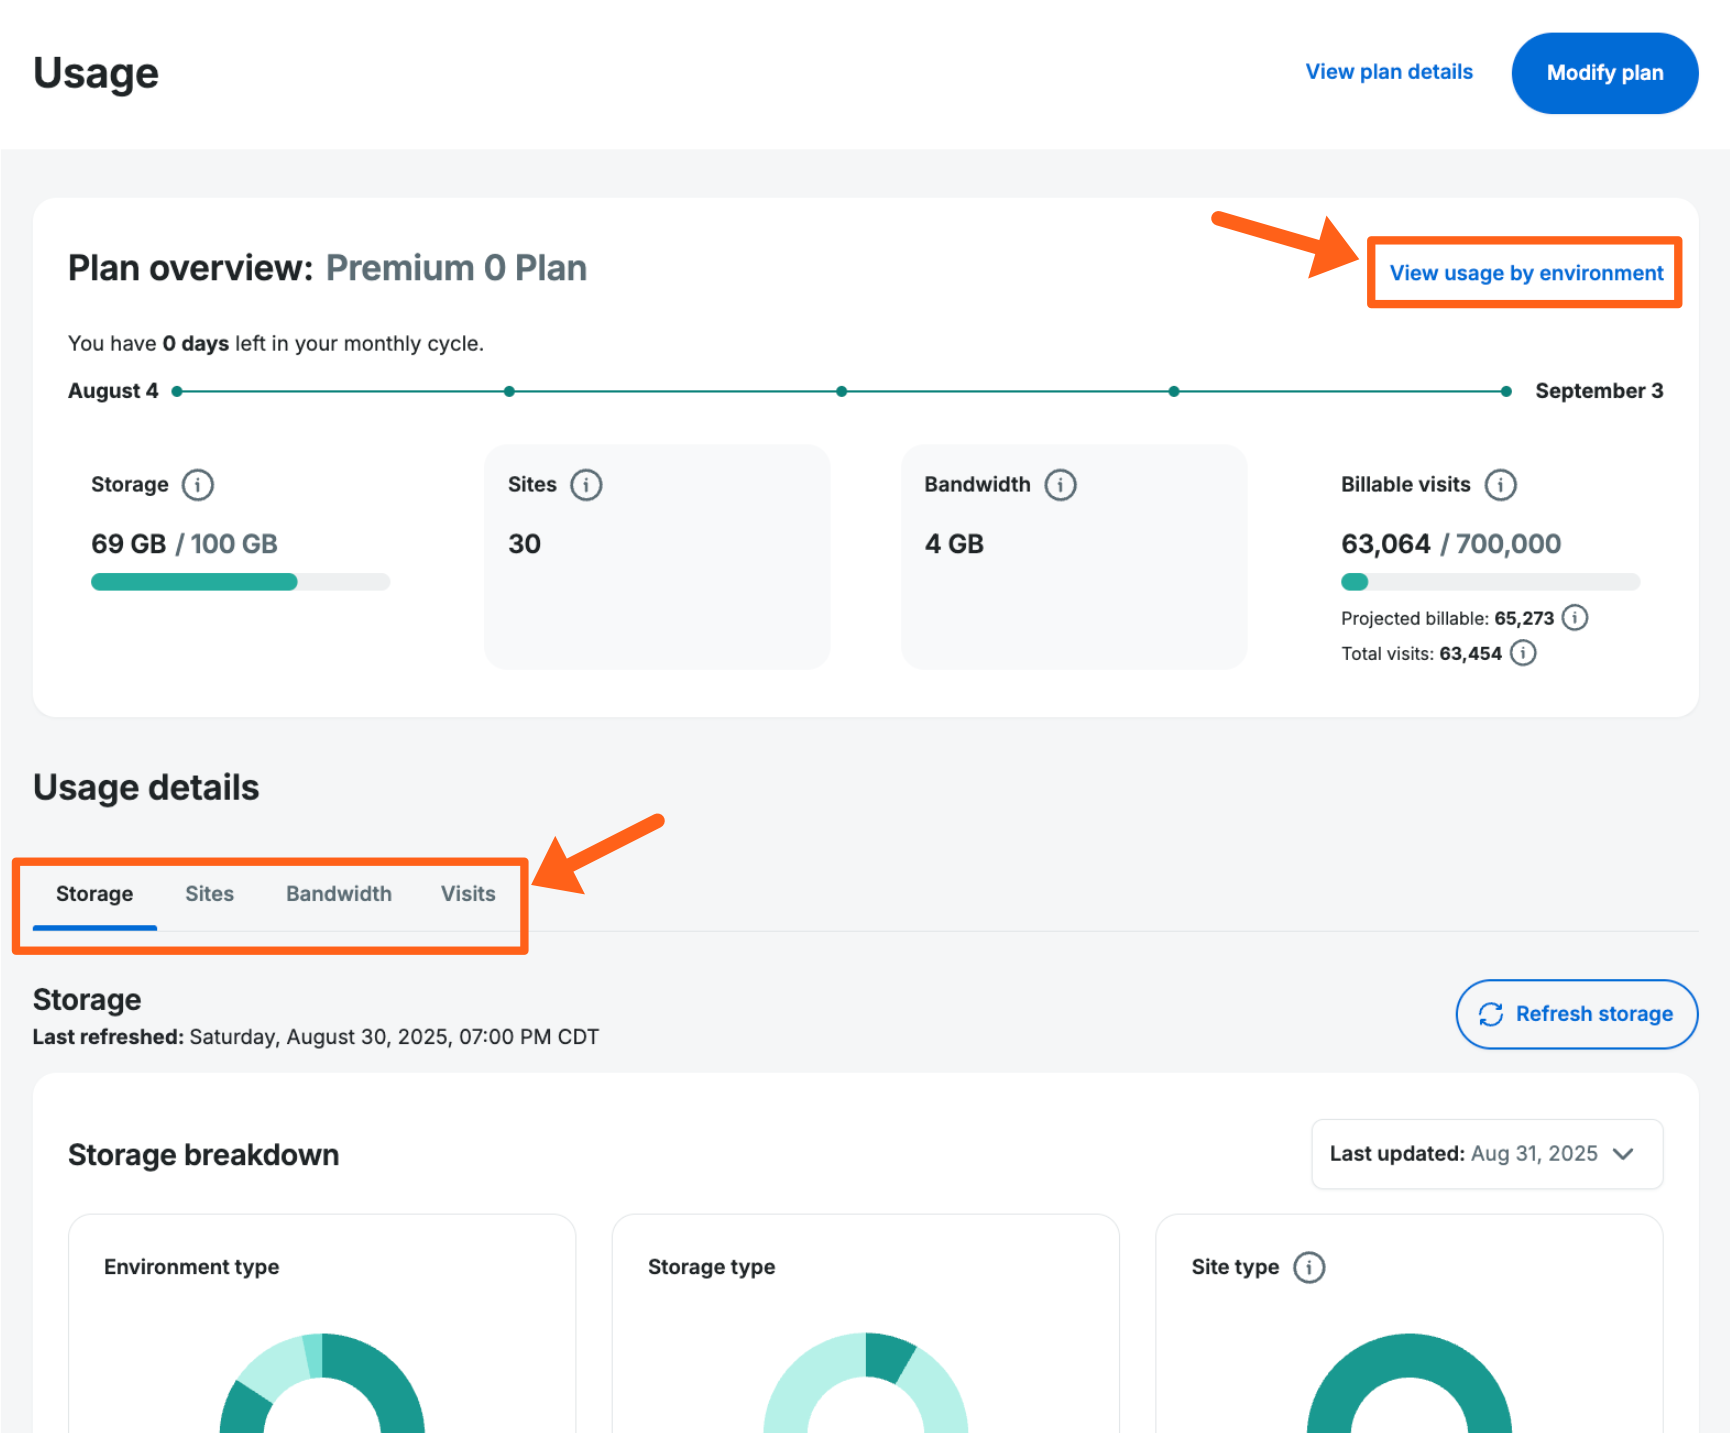
- To access the detailed views for each of the main categories use the links highlighted in the image below. The categories are storage, sites, bandwidth, visits, and usage by environment.
Usage Metrics
The primary metrics displayed are:
- Storage – Displays total account disk usage in gigabytes (GB). Includes all environments on the account (Production, Staging, and Development) and all transferable environments. Does not include WP Engine automated backups. Storage is updated weekly. Learn how to reduce storage usage here.
- Storage for an individual environment can be viewed and refreshed on the Overview page, in the Storage section.
- Sites – Shared accounts only (Lite, Startup, Professional, Growth, Scale). Total number of Billable sites on the account. Does not include transferable sites. Sites Used updates daily.
- Bandwidth – Total data transfer. Learn more about reducing bandwidth here.
- Billable Visits – Shared accounts only (Lite, Startup, Professional, Growth, Scale). Visits refers to the sum total of billable visits. WP Engine does not count every hit to a website as a billable visit. Visits are updated daily. Learn more about how WP Engine counts billable visits here.
Download Usage
Spreadsheets can be downloaded for an account usage overview, and for detailed reports of each of the main metrics tabs outlined in this article.
Account usage data can be downloaded as a CSV file by clicking the View usage by environment link on the main Usage page, then clicking Download CSV. Use the dropdown to customize the date range included in the download. Up to one previous year of data can be pulled when customizing the date range.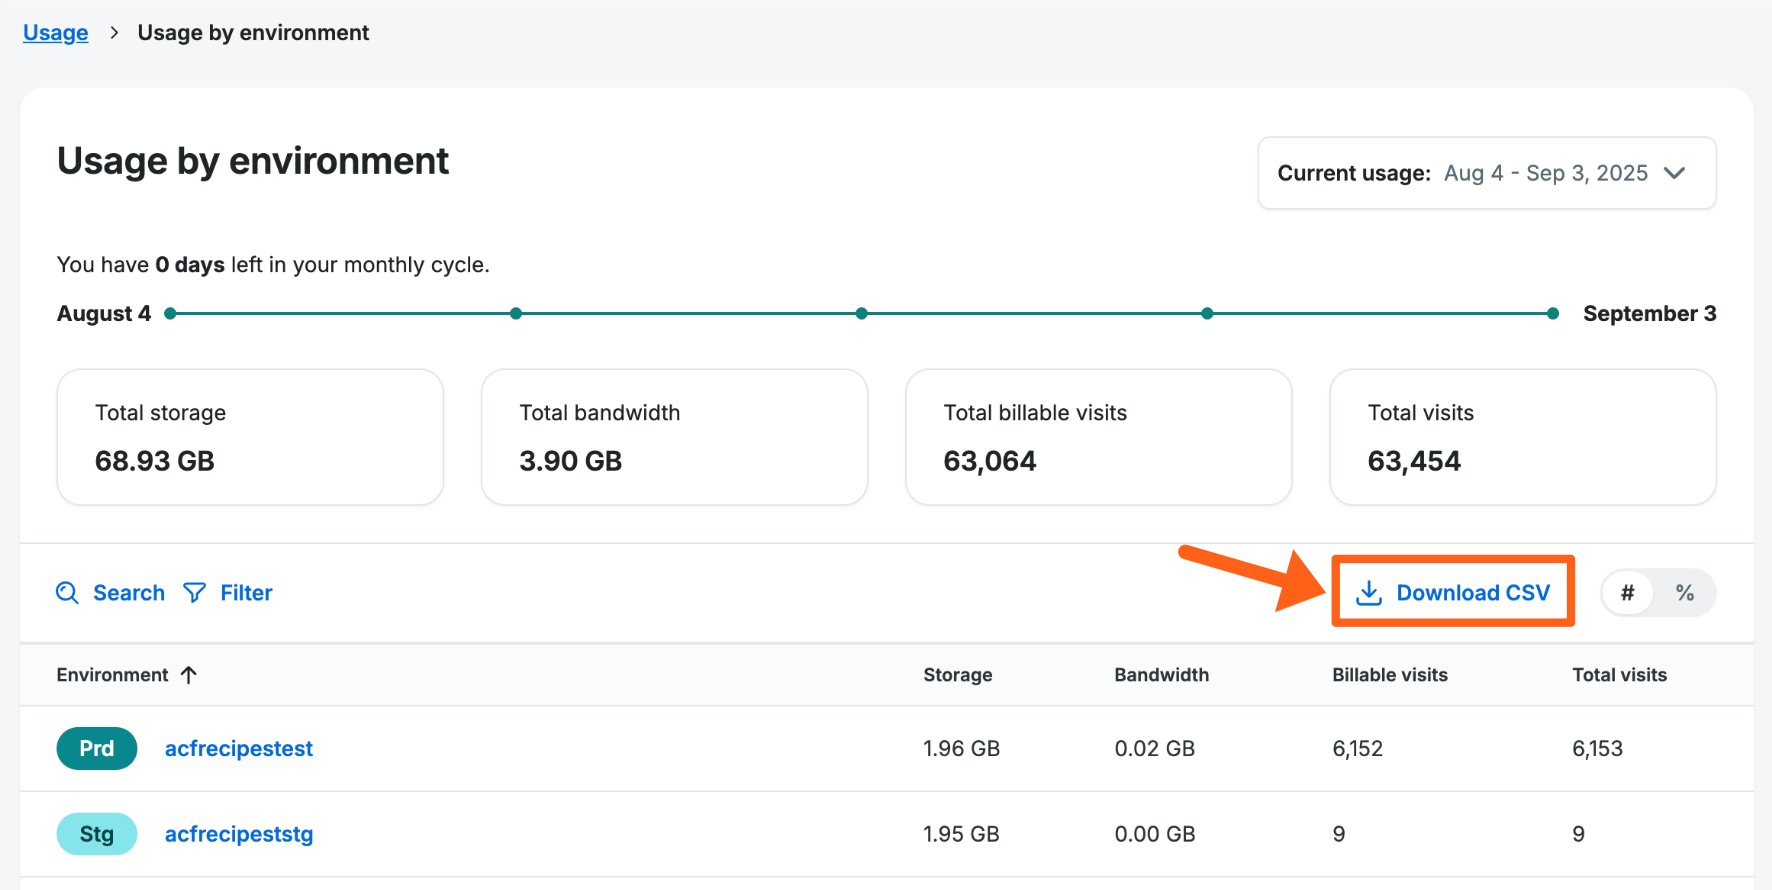
A usage CSV download will include the following information:
- Account Name
- Billing Cycle
- Environment name
- Environment type
- DB Storage (GB)
- File Storage (GB)
- Total Storage (GB)
- Storage date
- Billable Visits
- Total Visits
Detailed spreadsheets can also be downloaded for storage, bandwidth, and visits from the Detailed lists table of the main usage page. The storage and bandwidth tabs also have sub tabs which each have their own downloadable CSV files. The storage tab has sub tabs of environment, database details, and top 50 files. The bandwidth tab has sub tabs of environment, location, and URI as shown in the screenshot below.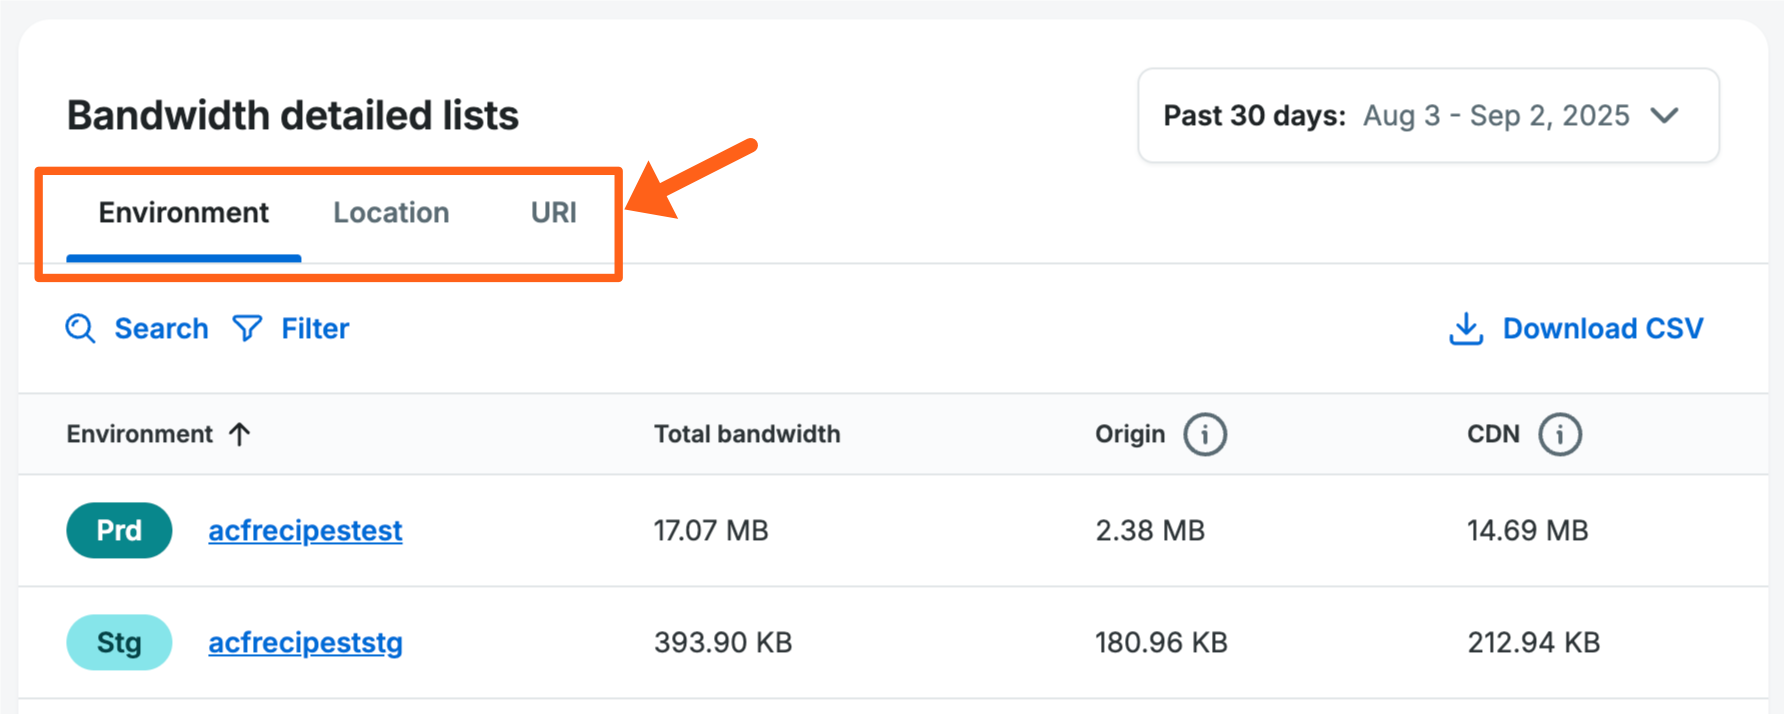
Storage
The detailed view for storage has 3 tabs with different views:
- Environment breakdown
- Database details
- Top 50 files
- Environment breakdown – This table shows details for each environment about its database storage, file storage, and total storage.
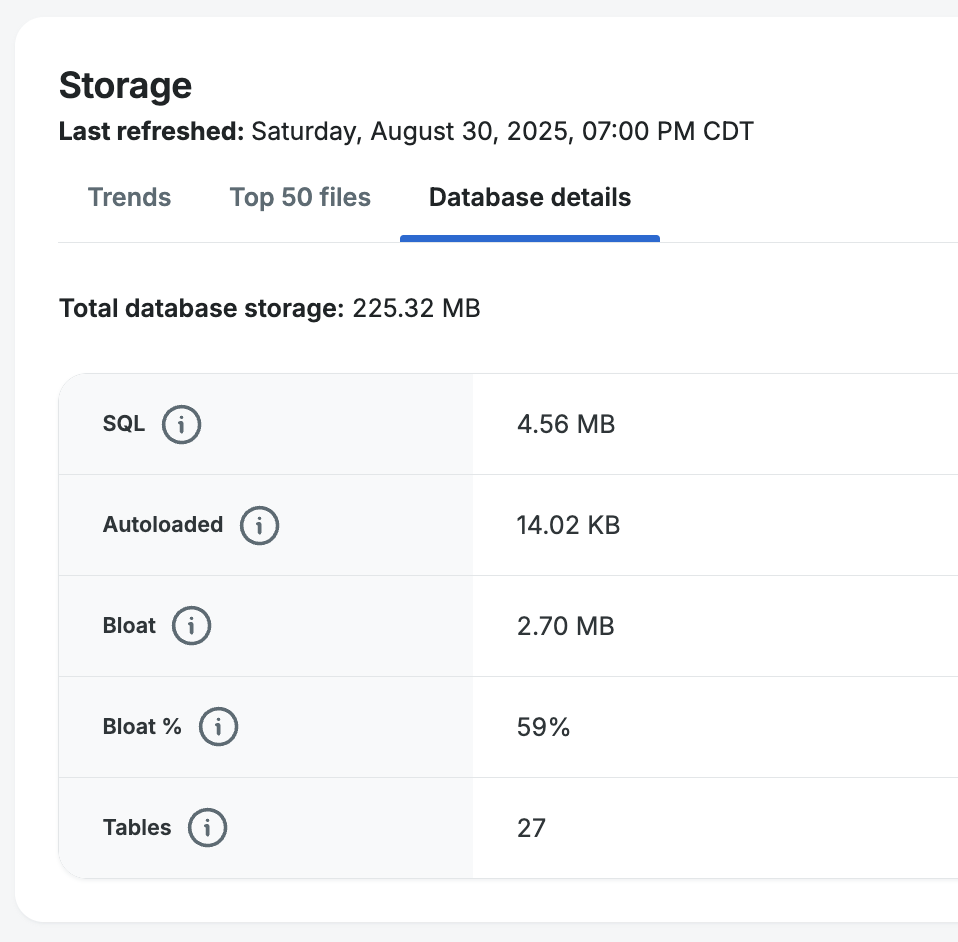
- Database details – The database details shown in this view are:
- Total db storage
- SQL – The amount of data stored in the database, as measured by the SQL engine, excluding temporary files and cache. This represents the actual size of structured records.
- Bloat – Unused or redundant space in the database caused by deleted or updated records that haven’t been physically removed. It can lead to inefficient storage and slower queries.
- Bloat % – The percentage of unused space in the database compared to its total size. A high percentage indicates excessive fragmentation and may require optimization.
- Tables – Total number of tables.
- Autoloaded – Data that is automatically loaded into memory on every request, often used for frequently accessed settings or options to improve performance. Excessive autoloaded data can slow down a system.
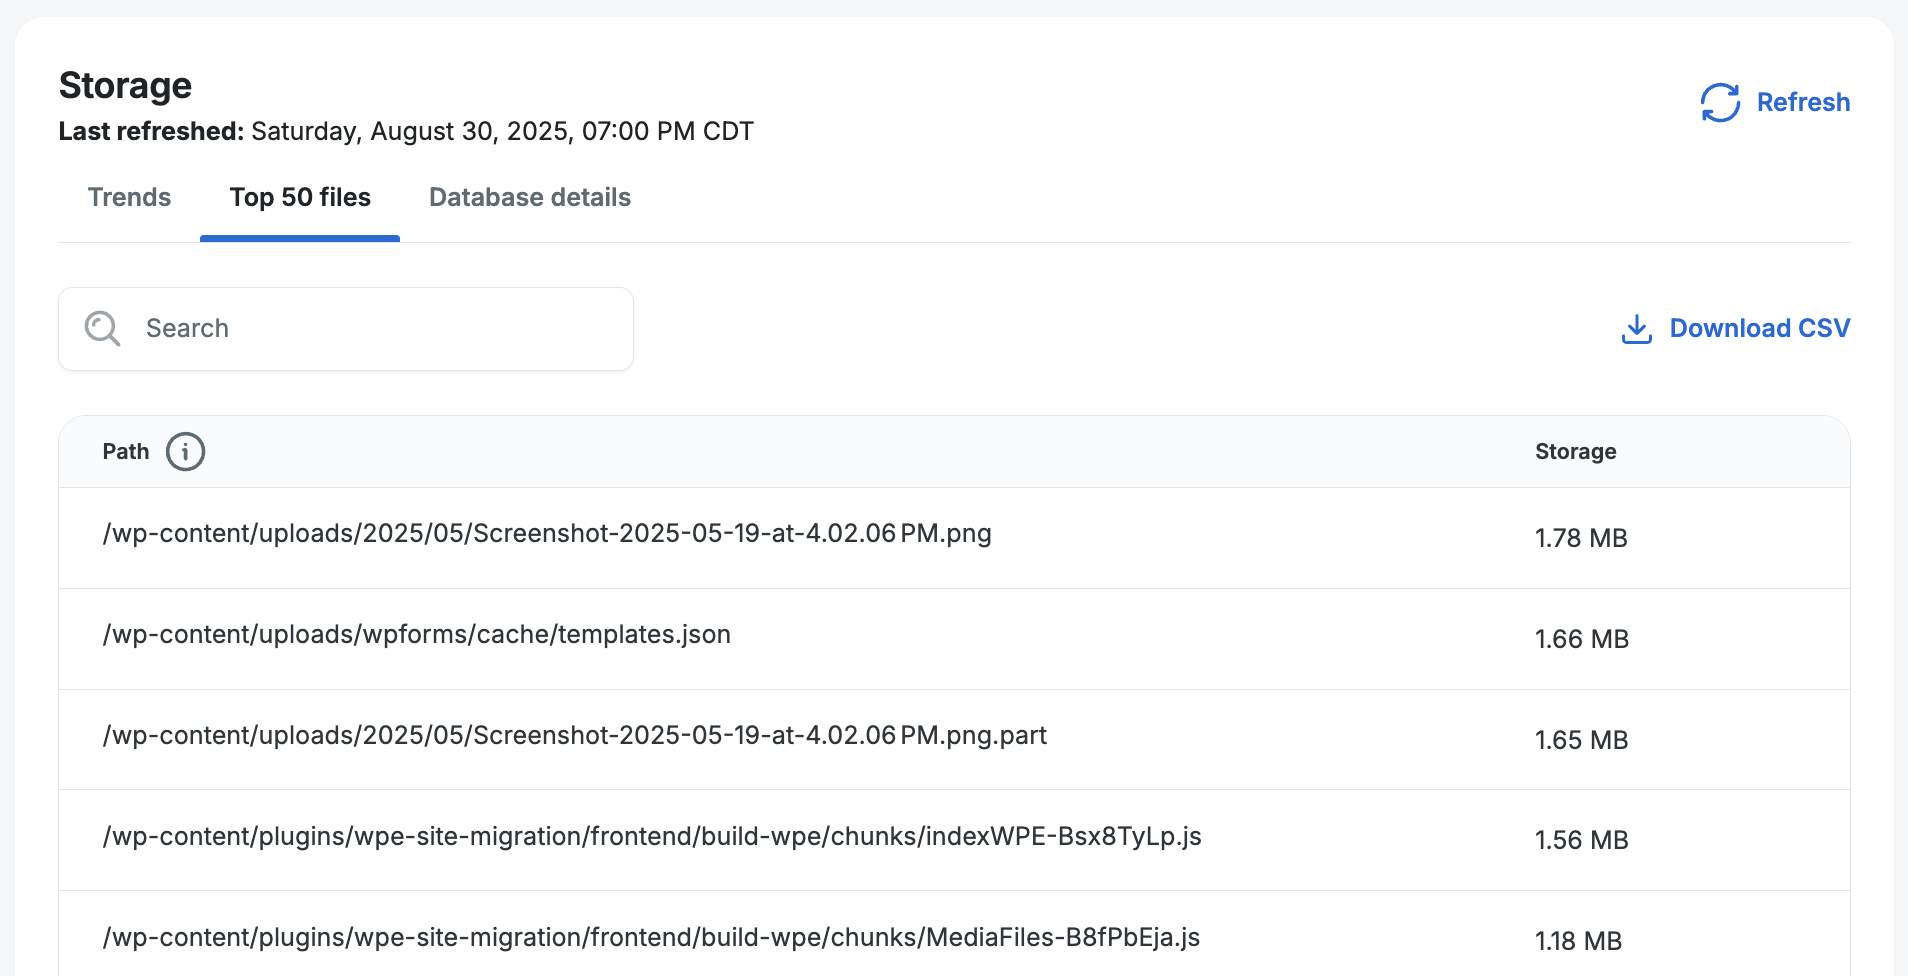
- Top 50 files – This table shows the 50 biggest files across all sites on an account with the environment name, file size, and the path to show what folder the file is in.
Bandwidth
The detailed view for bandwidth shows 3 tabs with different views:
- Environment
- Location
- URI
- Environment – This view shows the total bandwidth by environment and breaks down Origin vs CDN bandwidth.
- Origin – This refers to files that are loaded from your WP Engine server.
- CDN – This refers to cached versions of files that are loaded from the Cloudflare content delivery network of servers.
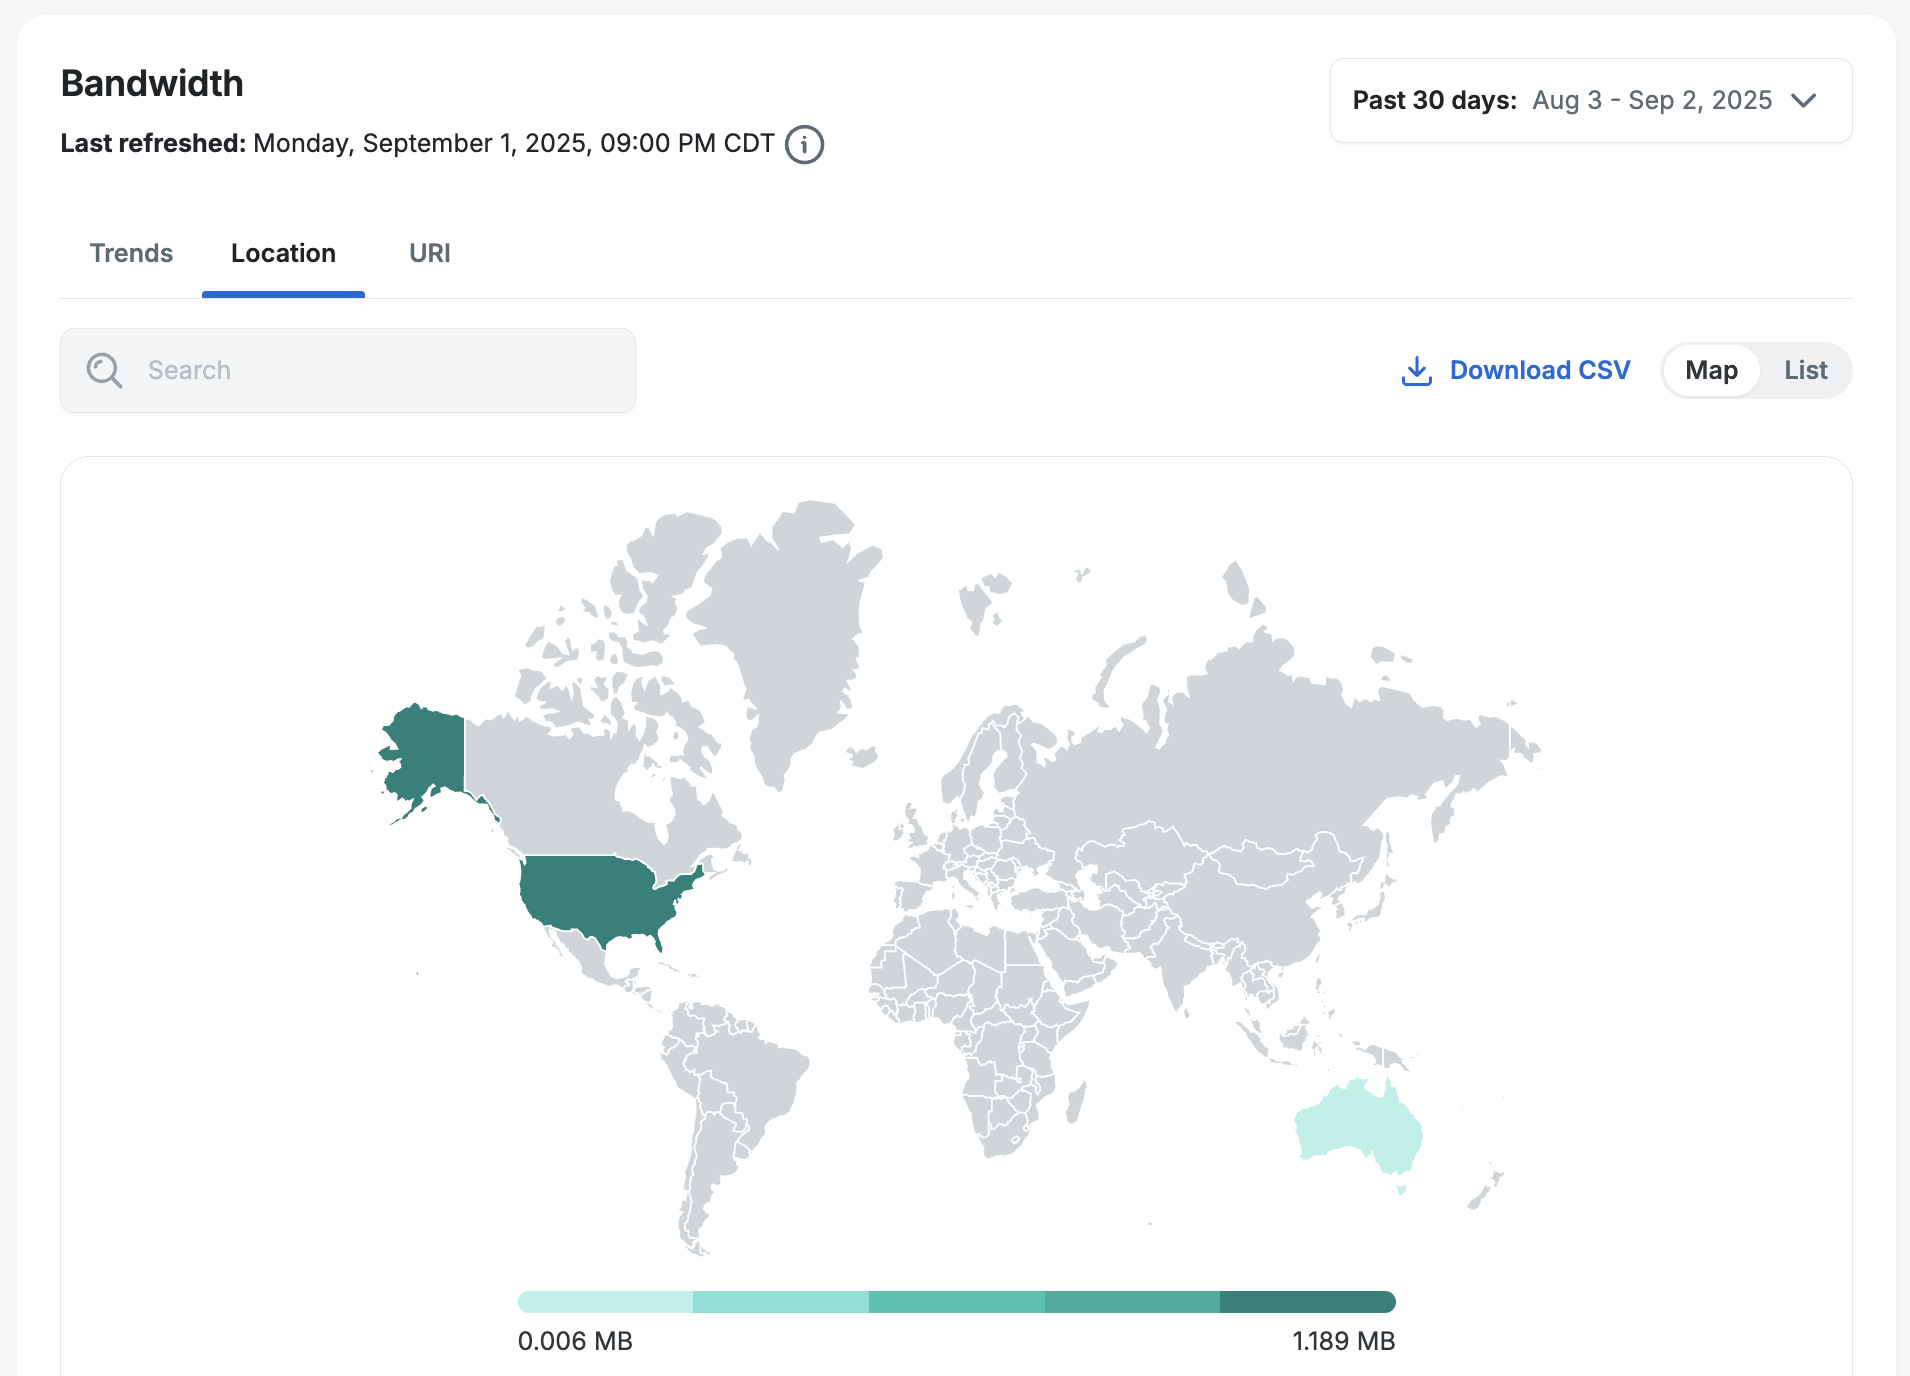
- Location – This view shows bandwidth transfers broken out by country. It shows the country, the total bytes of data transferred to the country, and the total page views from the country.
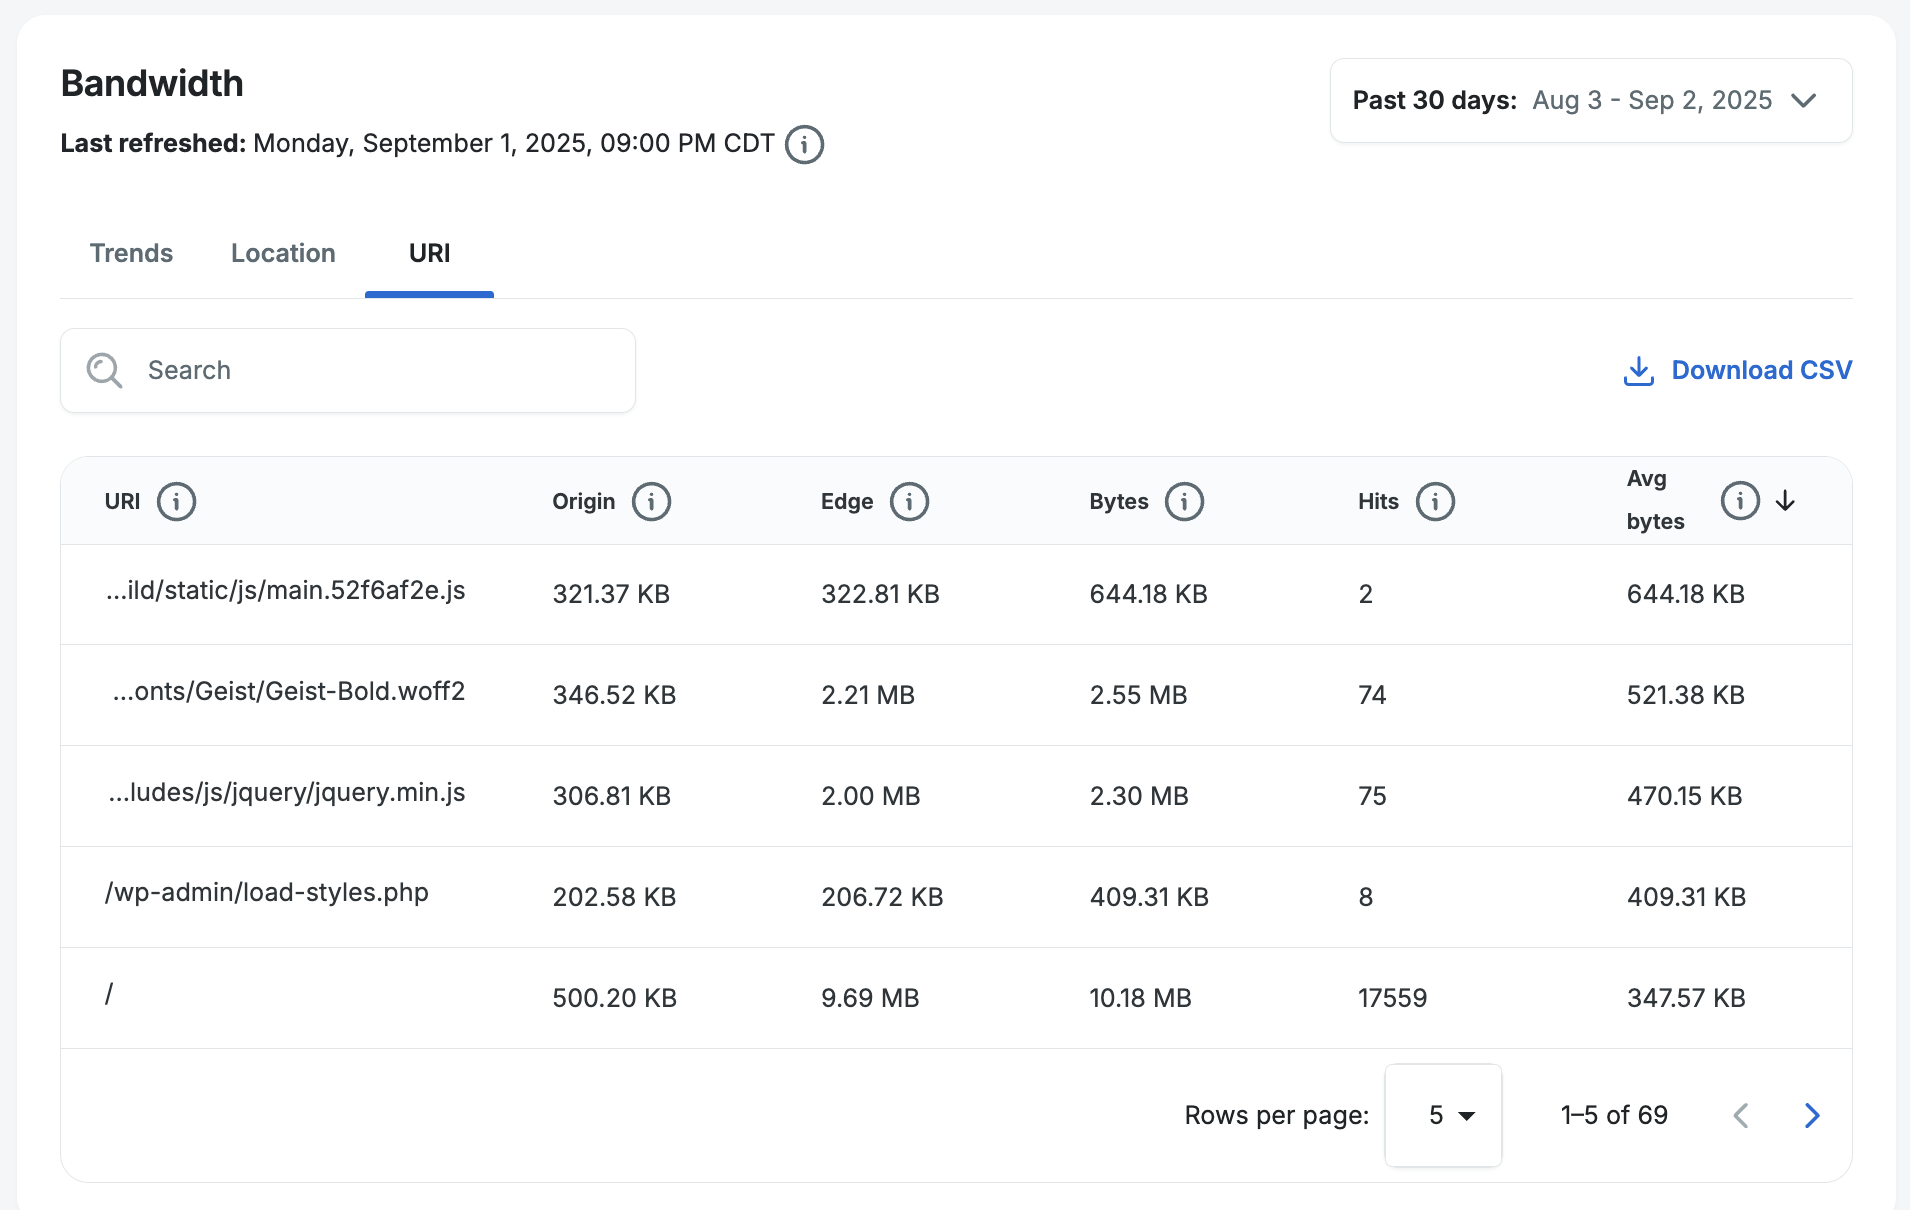
- URI – This view shows the top files by the number of bytes transferred to visitors. It shows the following data:
- URI – This shows the folder path and file name for the file.
- Environment – This is the environment that the file was loaded from.
- Origin – This shows the amount of bytes for the file that were transferred from the WP Engine server for the account.
- Edge – This shows the amount of bytes for the file that were transferred from Cloudflare’s CDN.
- Bytes – This shows the total number of bytes that were transferred for the file.
- Hits – This shows the total number of times that the file was transferred.
- Avg bytes – This shows the average number of bytes that were transferred for the file each time it was loaded. This can be helpful to see since the number of bytes transferred each time is not always the same even though files are a static file size. This is because the requester can stop the transfer from their browser before it completes. A good example is a long video that starts playing and the browser tab is closed before the video completes transferring to the visitor’s computer.
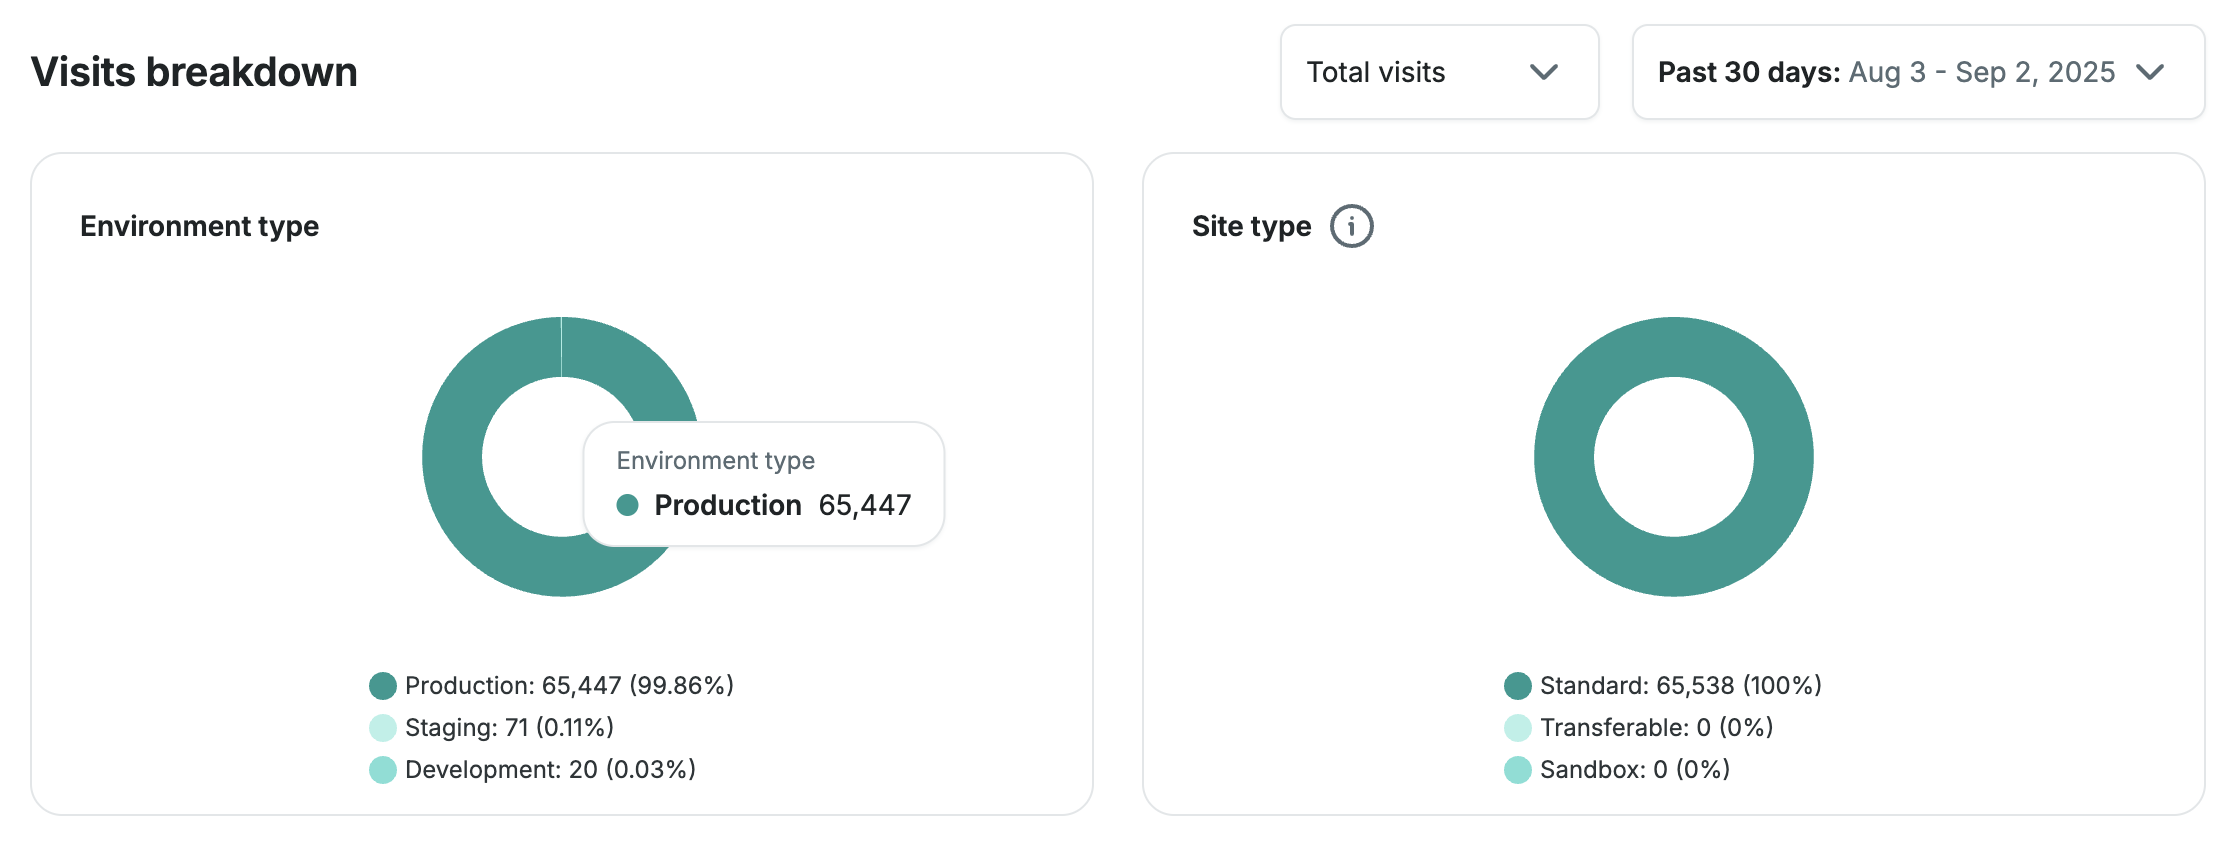
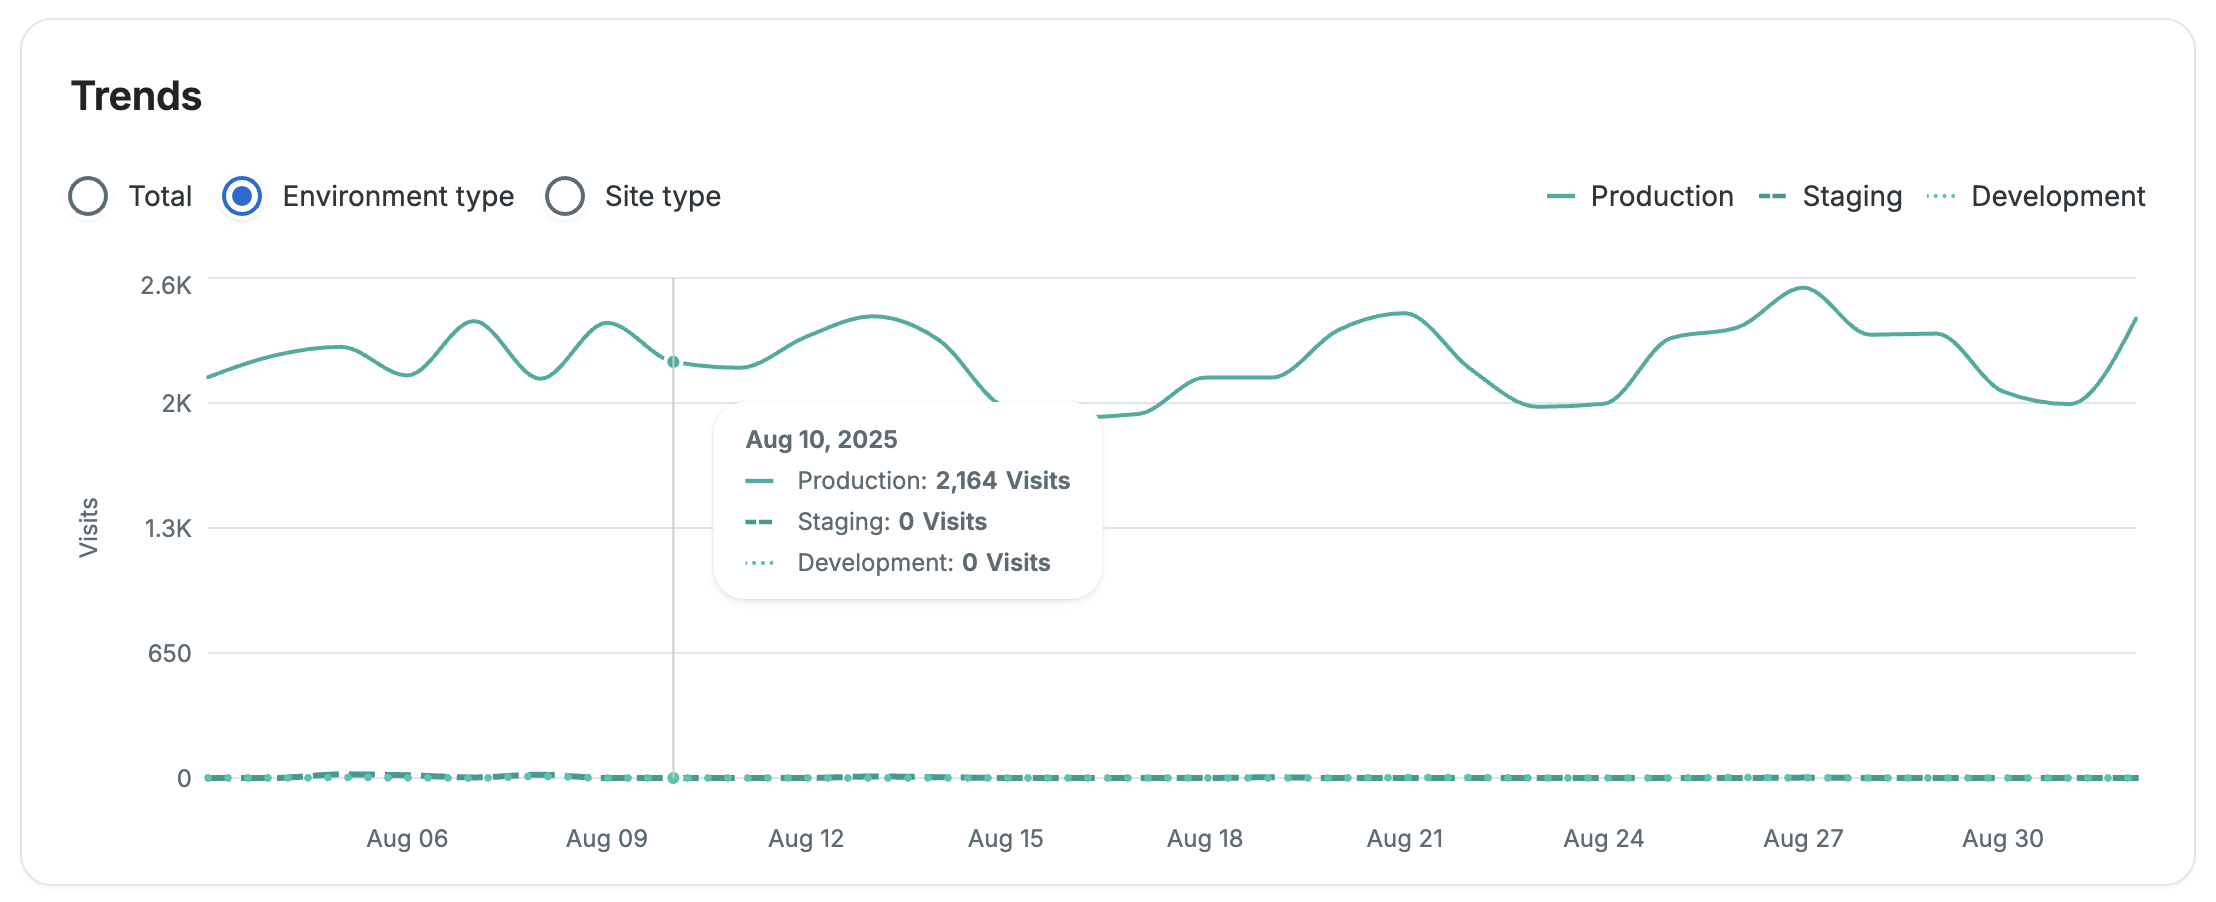
Visits
The detailed view for visits shows a breakdown of billable and total visits by environment and also a breakdown of visits by environment type and site type for your selected date range.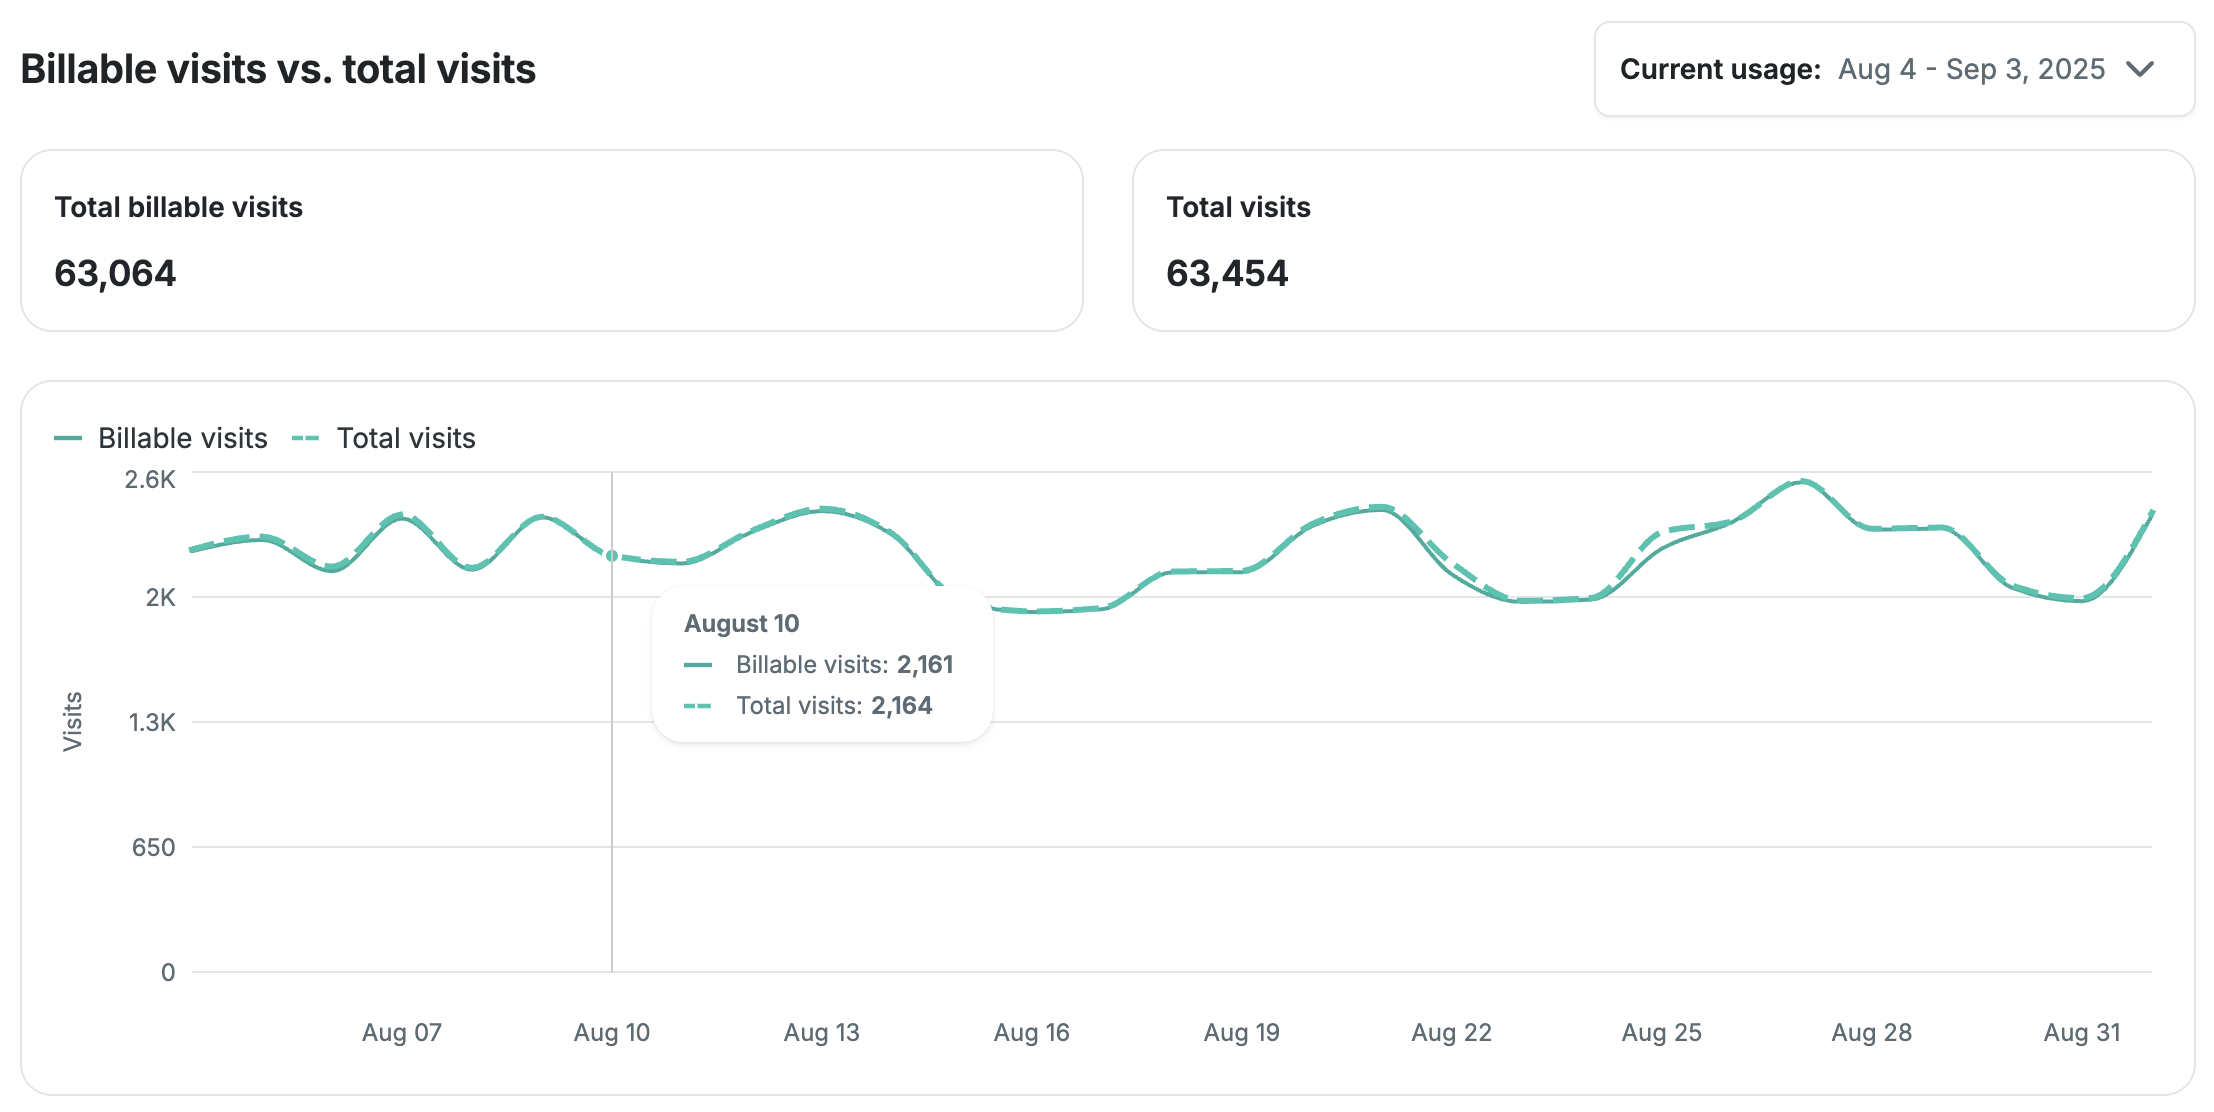
Usage by Environment
The link to this page is not grouped with the main category tabs. You can view this page by clicking the link labeled View usage by environment, in the top right of the main usage page as shown below.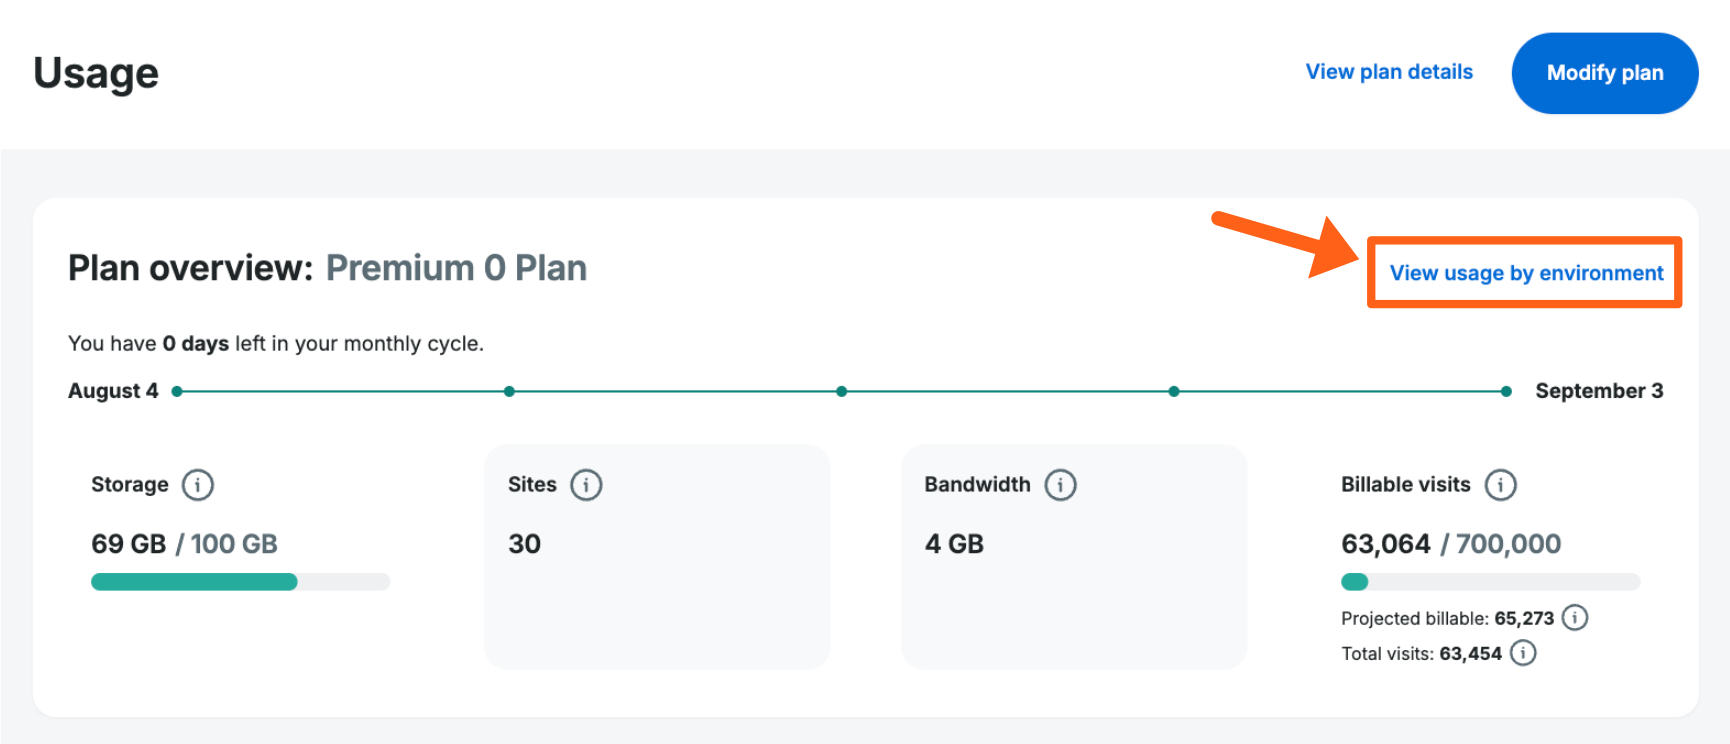
This page shows a breakdown of storage, bandwidth, and visits by environment.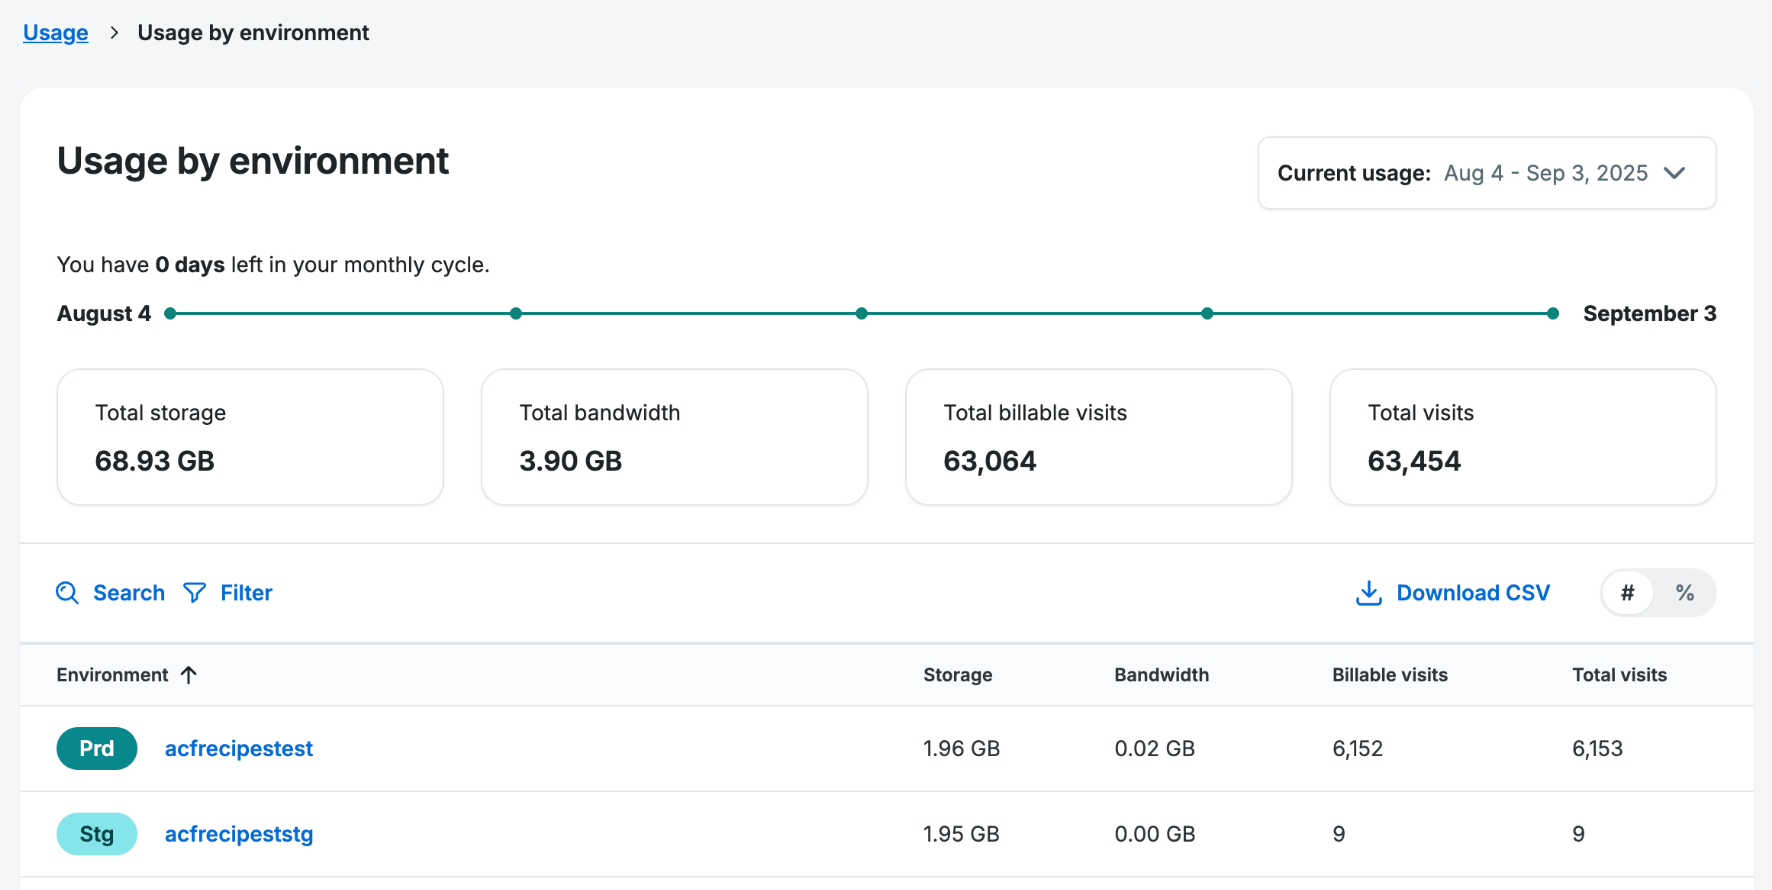
Detailed Usage Page for Environments
The environment-level usage page shows detailed usage stats for storage, bandwidth, and visits. From an environment’s overview page, you can get to it from the secondary left menu by expanding Insights and selecting Usage as pictured below.
Note: This is different than selecting Insights > Usage in the main left menu which goes to the account-level usage page.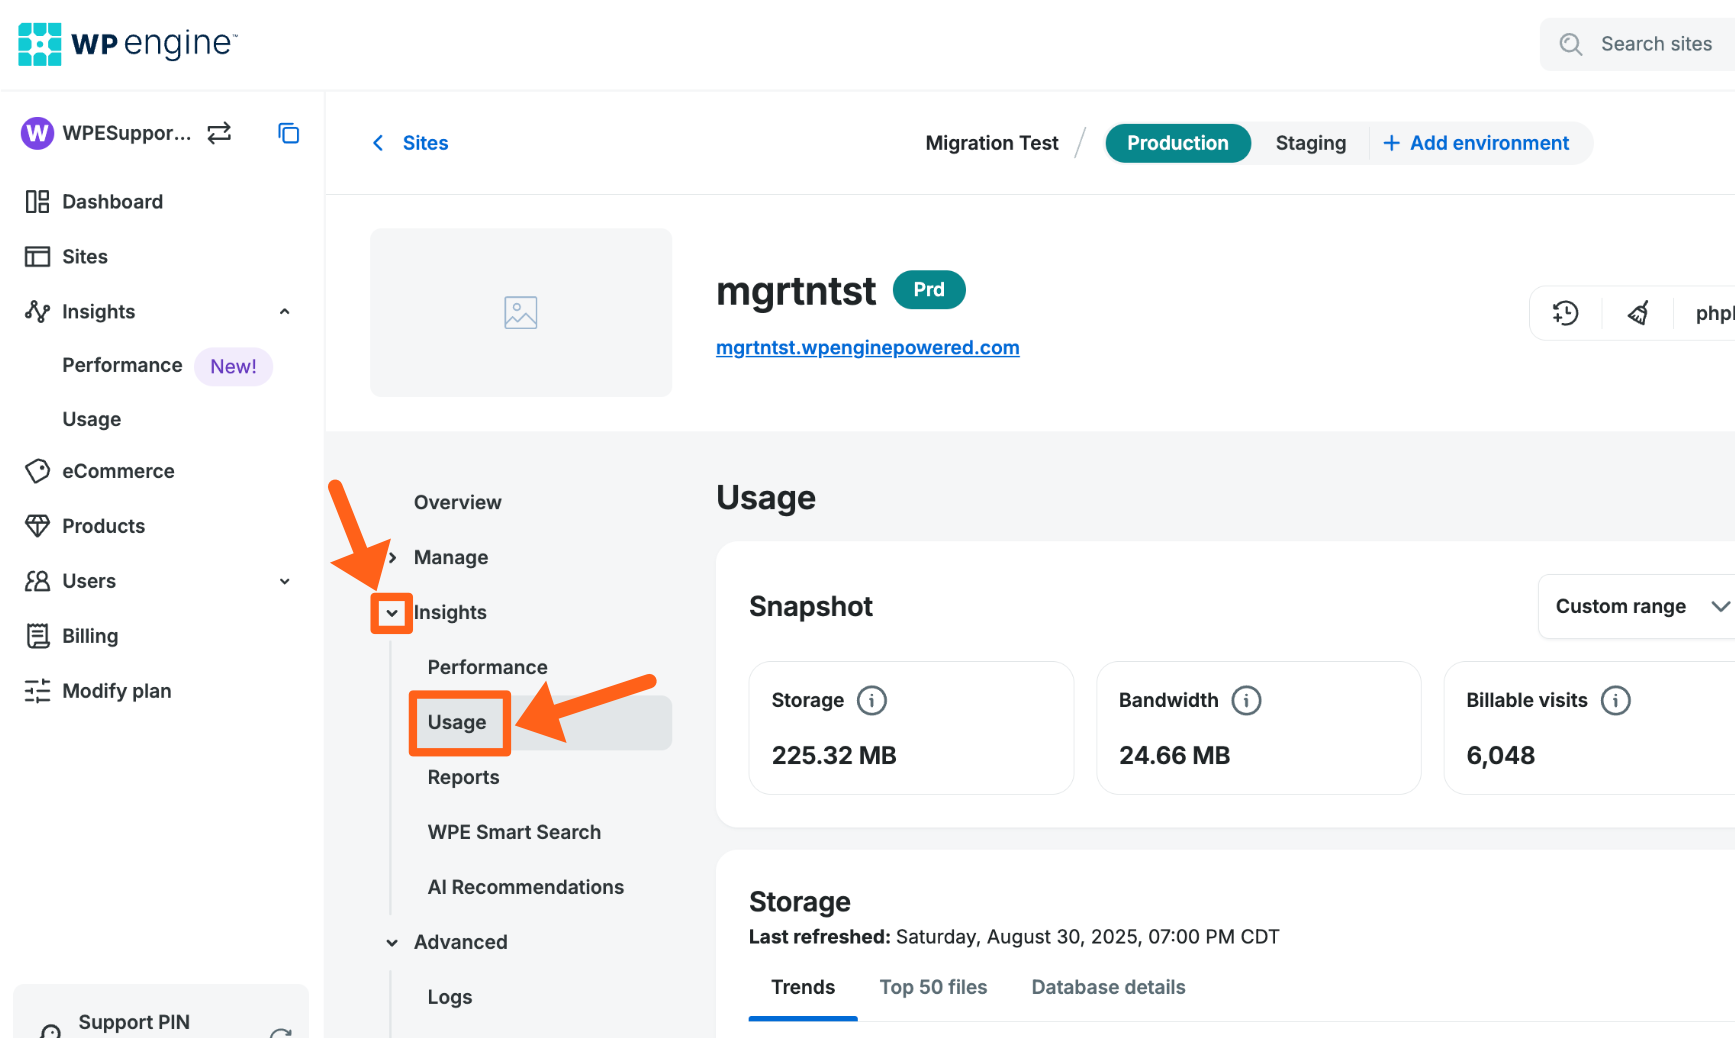
All of the stats for the 3 different categories can be viewed in date ranges of past 30 days, current 30 day usage cycle, past 6 months, or a custom 30 day range. Hover over graphs and info icons for additional details.
Environment Storage
The environment storage graphs and tables show trends of file and database storage totals, the top 50 biggest files, and database storage details, as shown in the screenshots below. Toggle between the 3 views by selecting the tabs above the graph to the left.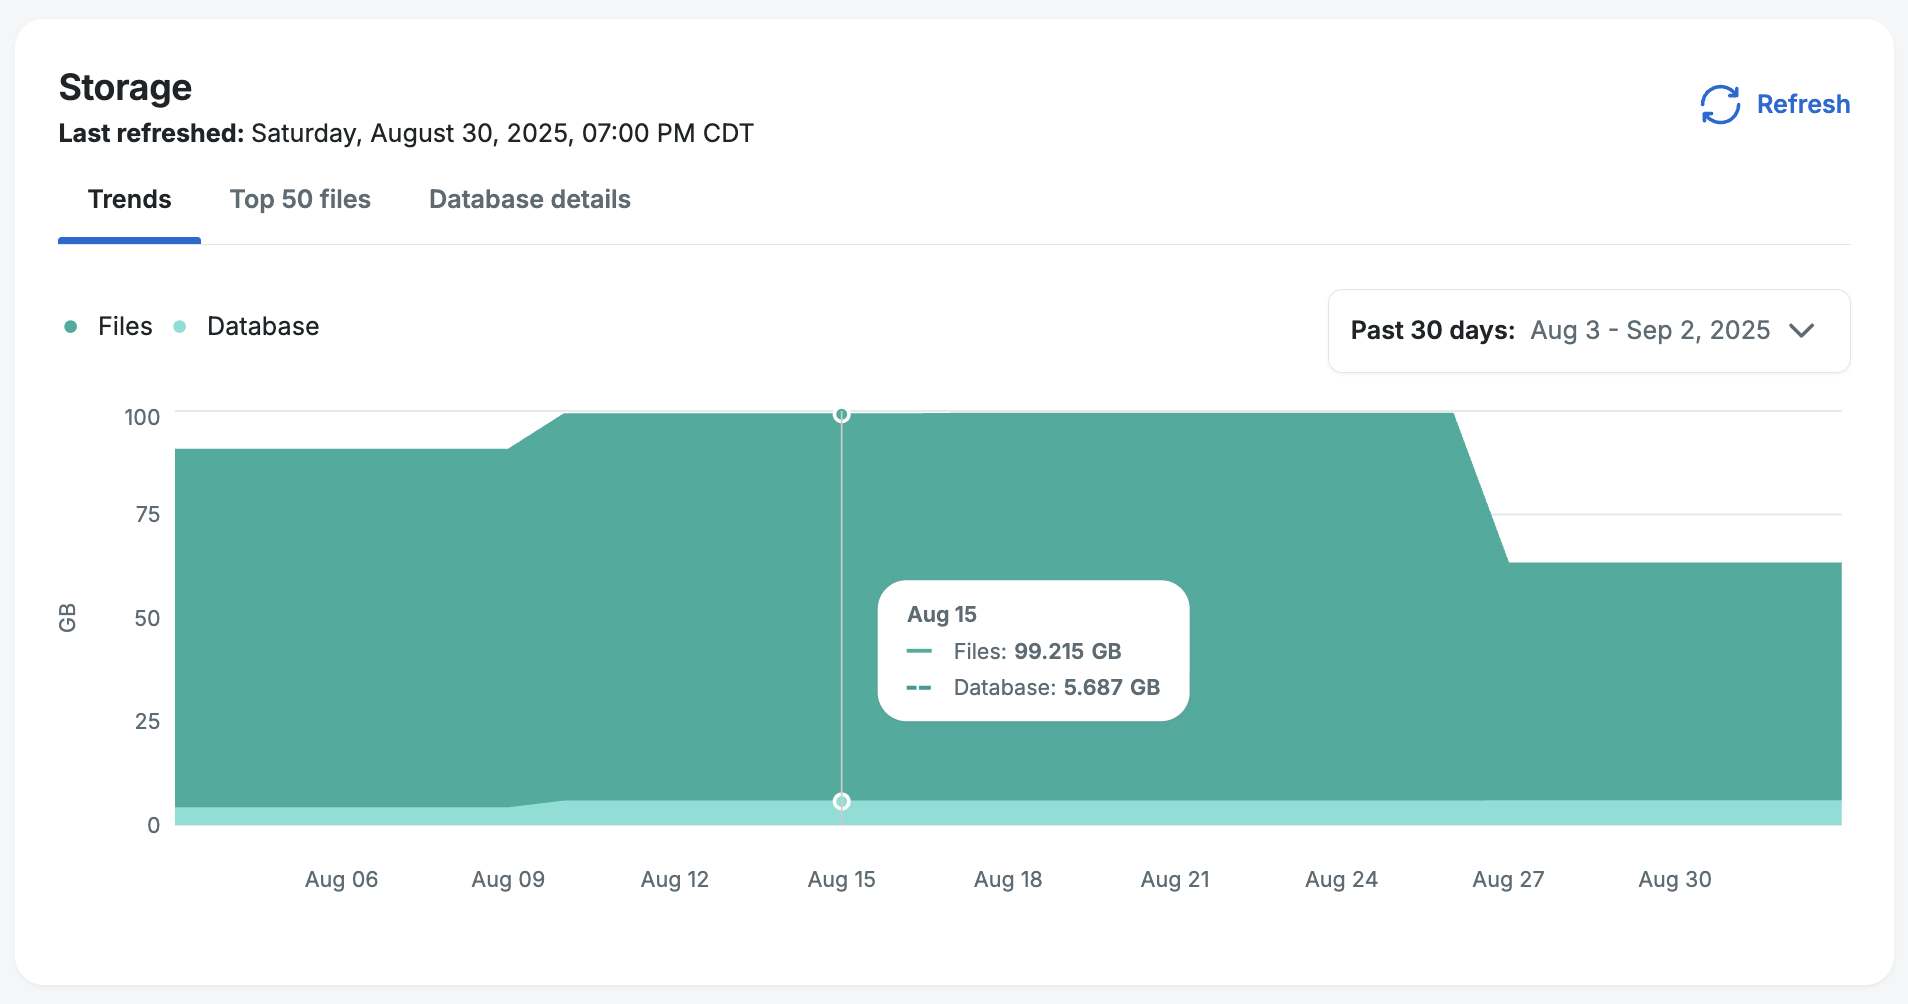
Environment Bandwidth
The environment bandwidth graphs and tables show trends of origin* and CDN* bandwidth totals, bandwidth by location for the top 20 countries, and the URI of the top files using bandwidth, as shown in the screenshots below. Toggle between the 3 views by selecting the tabs above the graph to the left.
*Origin: Origin traffic refers to web requests that are served from WP Engine servers.
*CDN: CDN (content delivery network) traffic (also known as “Edge” traffic) refers to web requests that are served from a network of server locations around the world which store cached versions of your website’s files. This helps to load pages faster for visitors to your website. For WP Engine the CDN being used is the Cloudflare CDN.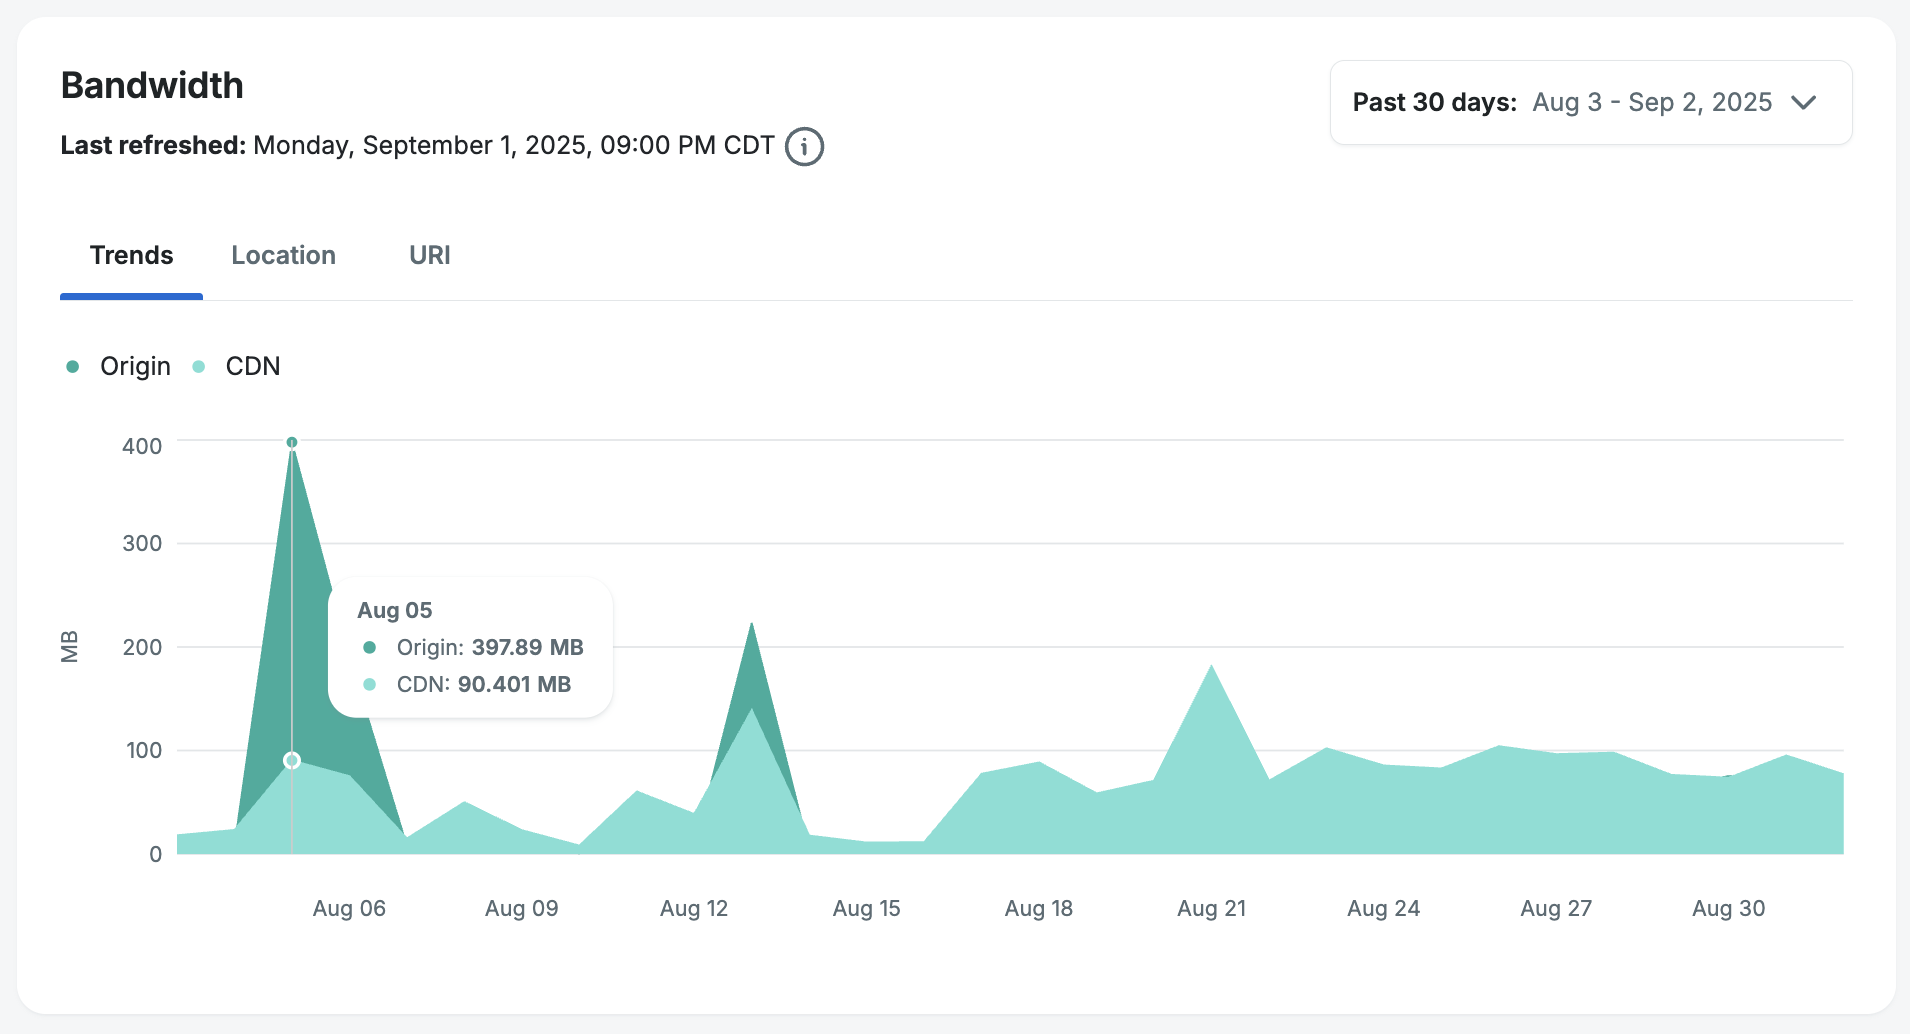
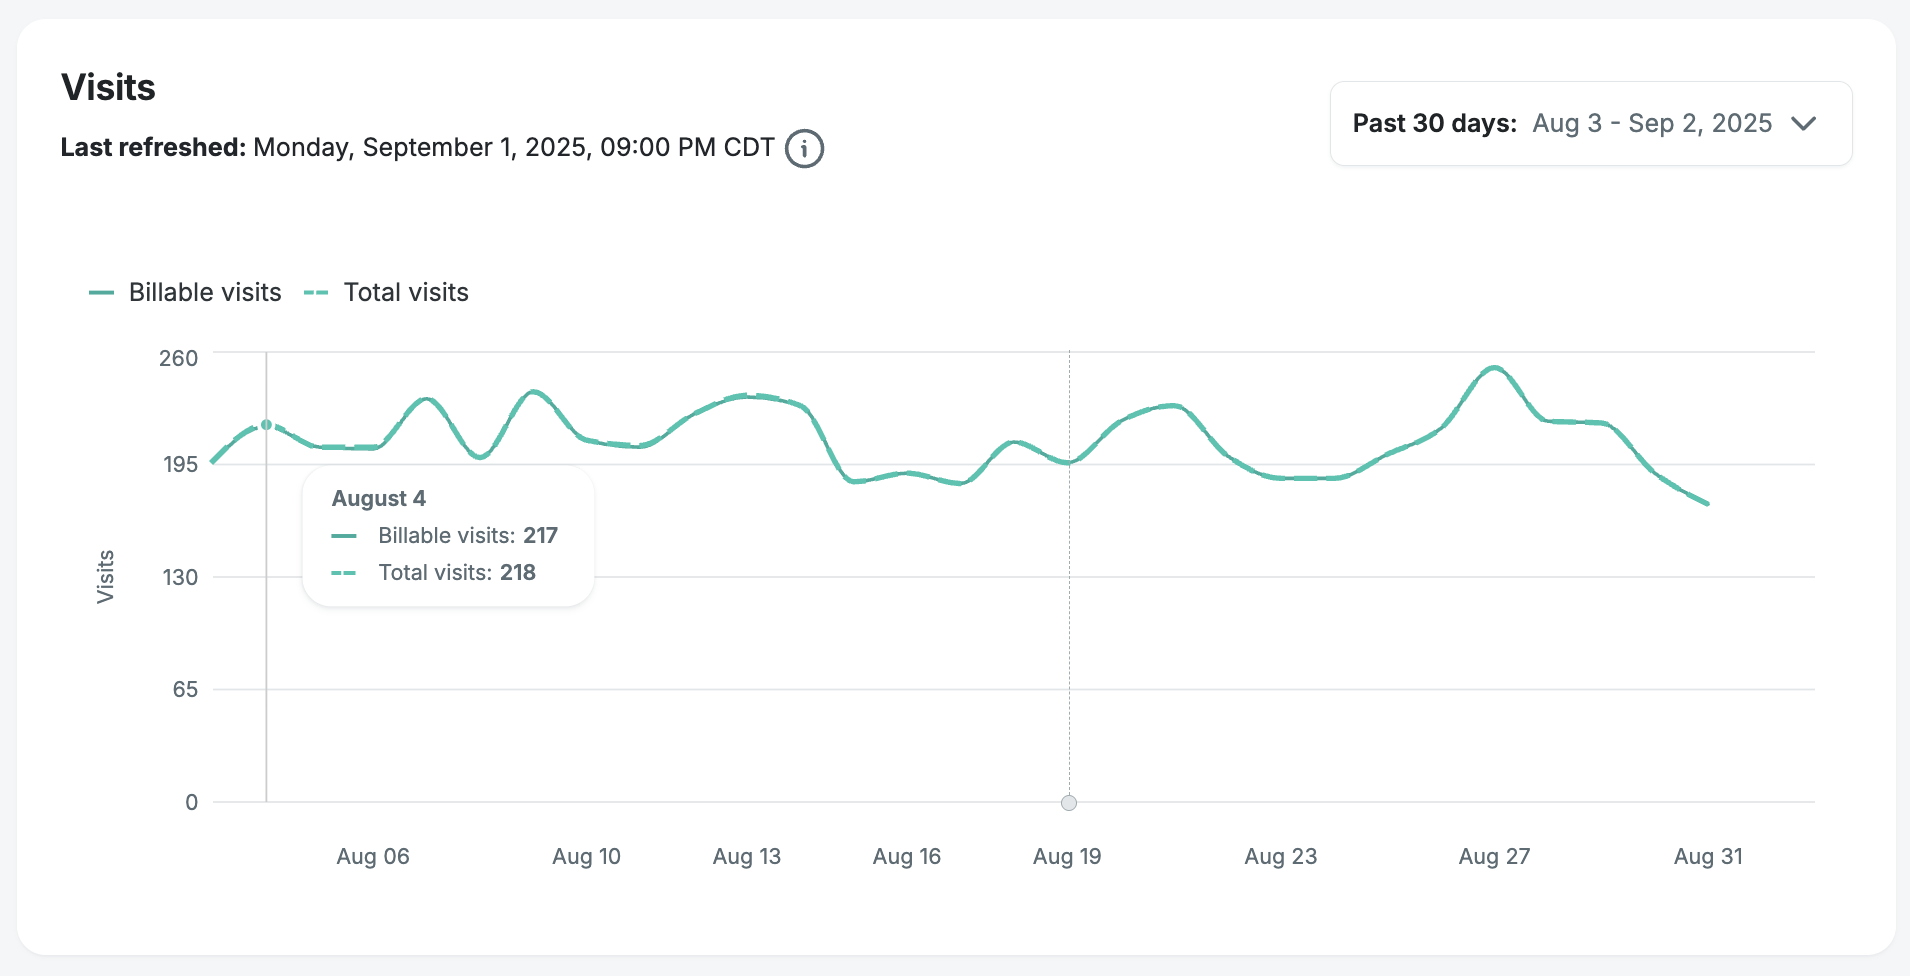
Environment Visits
The environment visits graph compares billable visits to total visits over your selected time range, to help you to monitor for any spikes in billable visits.