Performance Insights
We have done a lot of work to understand what is really important when it comes to the performance of your website. We’ve identified metrics that we think are vital to performance and we’ll go over why we think each is important and steps you can take to improve each metric.
Research tells us that customers are more loyal to trustworthy, easy-to-use sites. This perception is heavily influenced by the speed of your site. Based on Google’s experimental results, we know that sites that can deliver content in 800ms are perceptibly faster than those that take 1500ms. While each customer is different, many don’t trust sites that consistently take over four seconds to load.
Access the Performance Insights Page
To access the performance insights page for an environment:
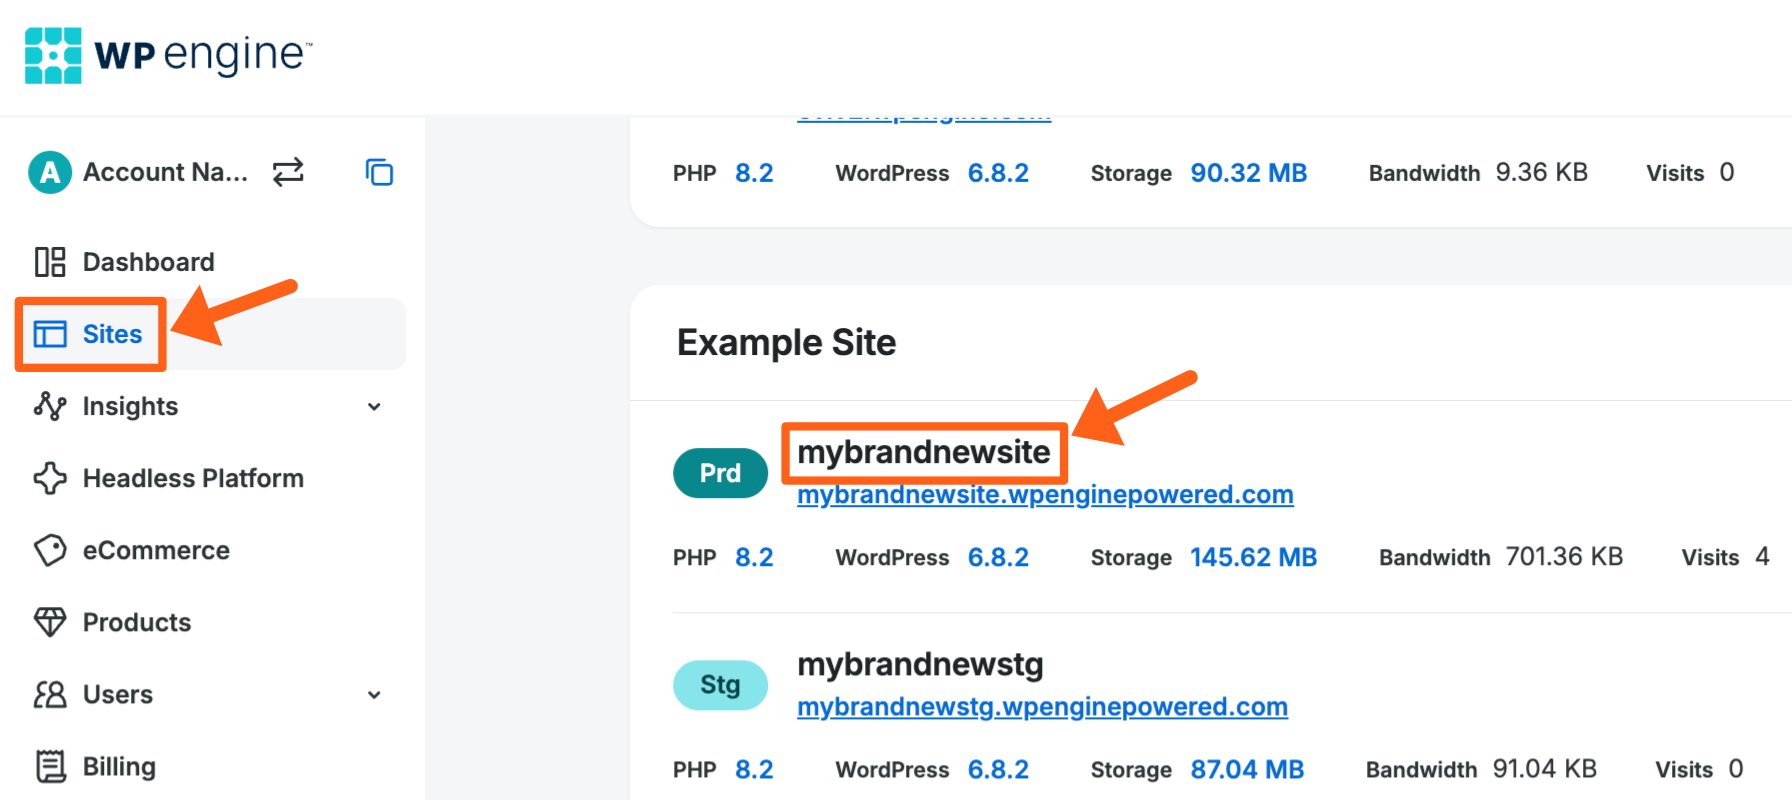
- On the Sites page of the User Portal, click on the environment name that you want to view.
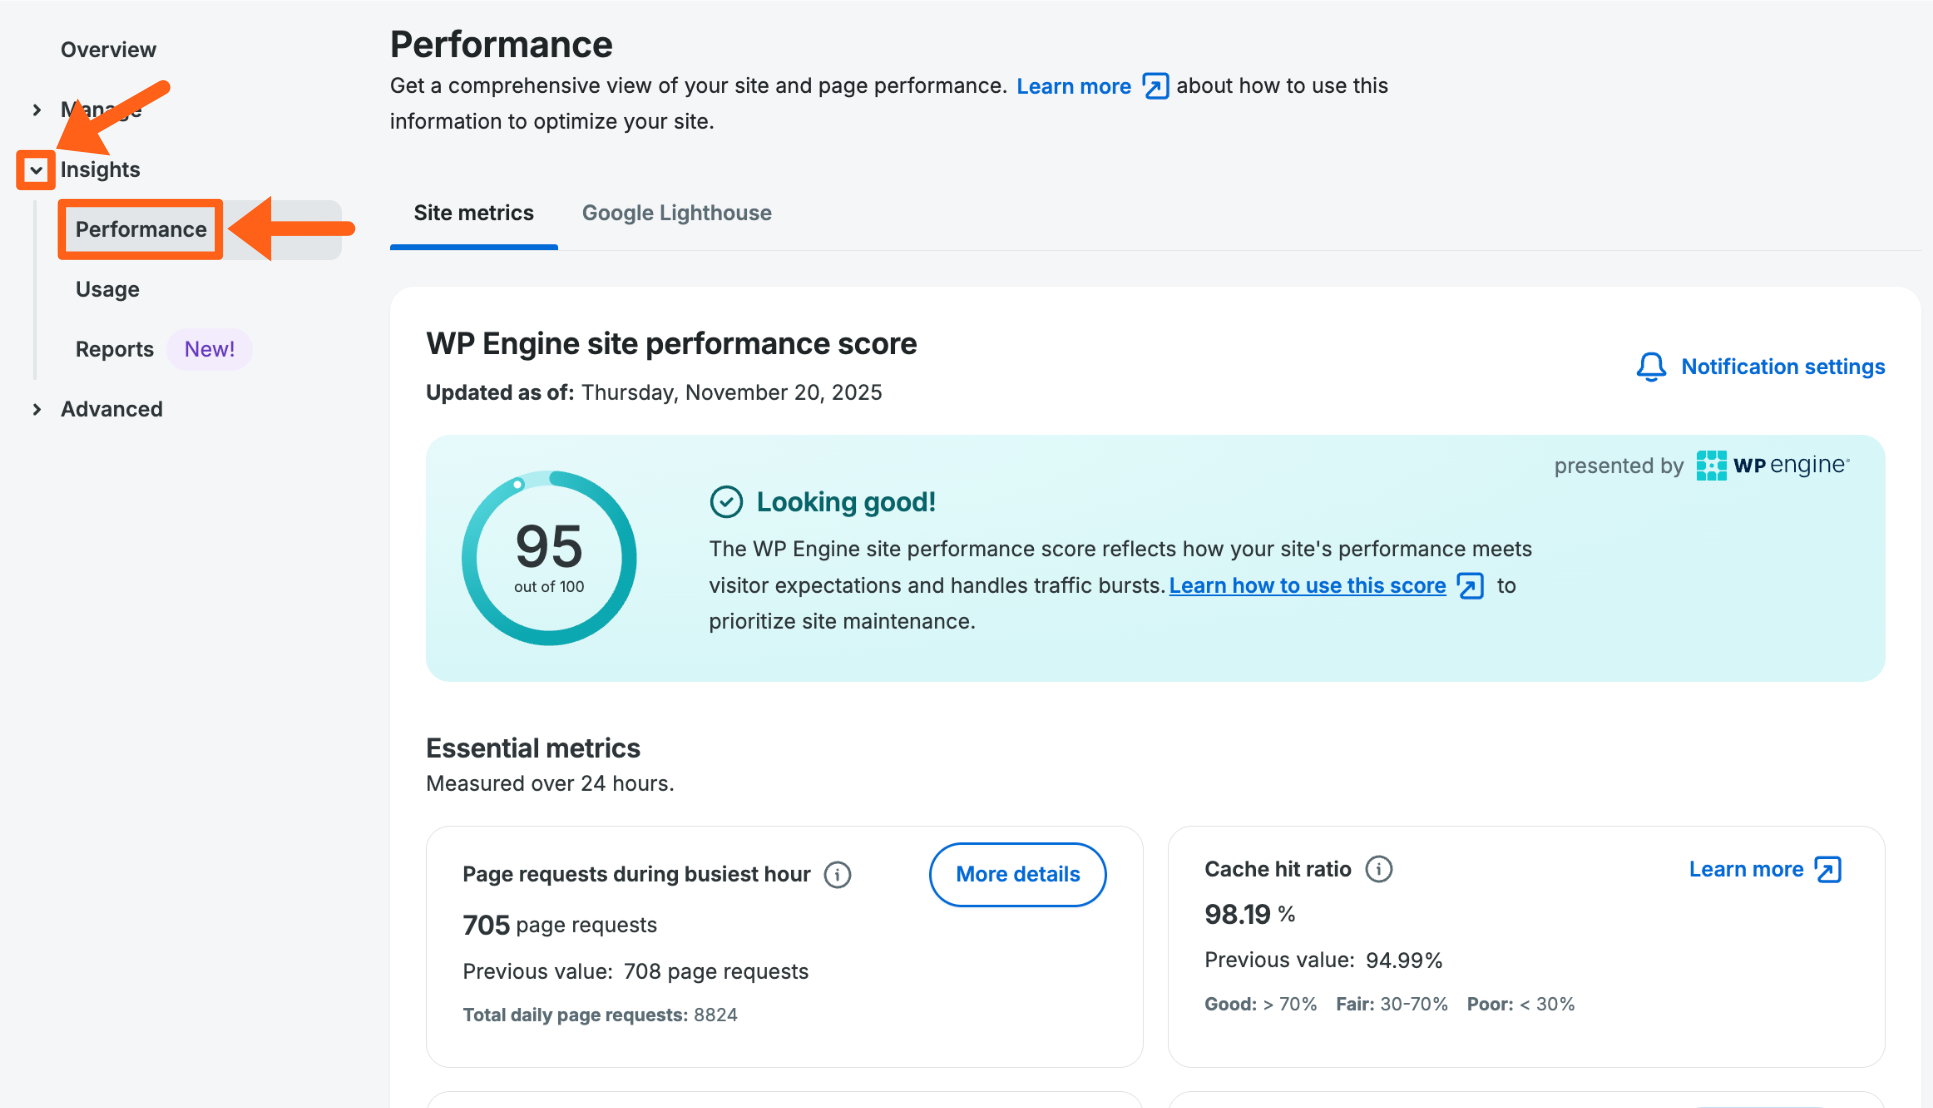
- Expand the Insights section in the secondary left hand menu, and select Performance.
You can also see your Google Lighthouse scores on the performance page by selecting the Google Lighthouse tab as shown below. Read more about your Google Lighthouse scores.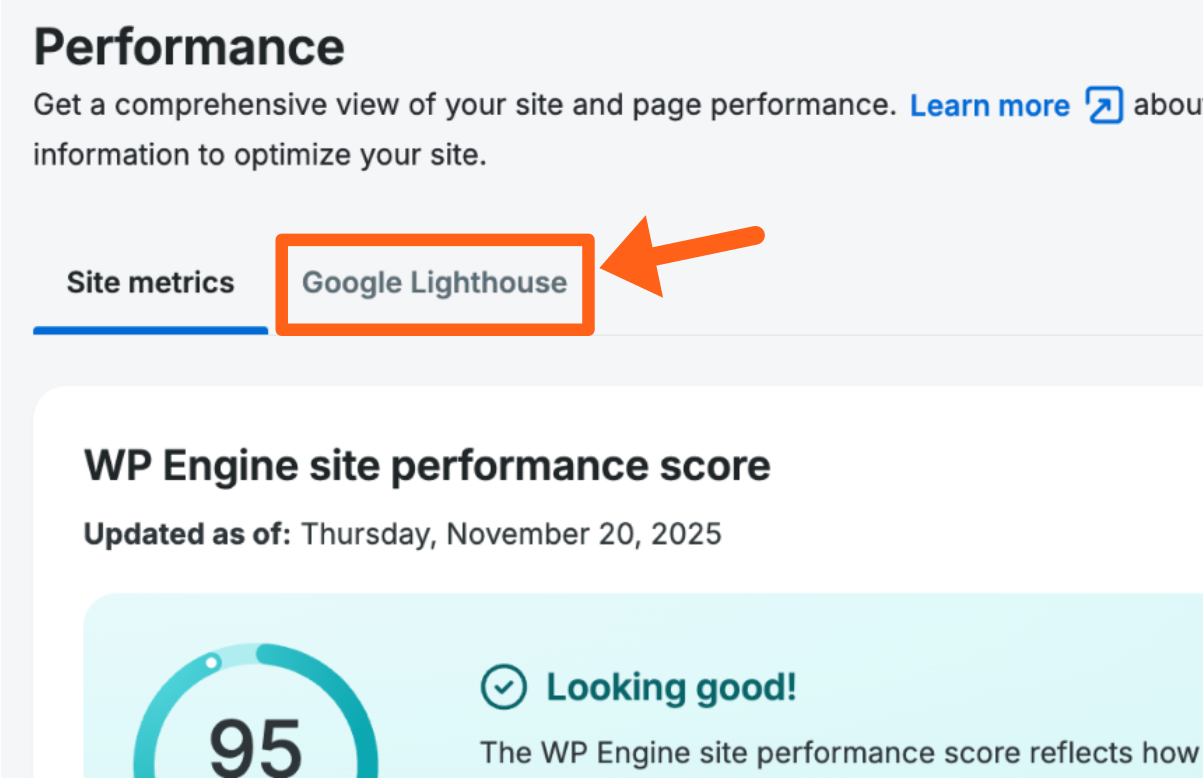
WP Engine Site Performance Score
Our site performance score is a metric that assigns an overall health score to your website’s performance based on metrics that we think are key in delivering a great experience to your visitors.

Why the WP Engine Site Performance Score is Important
WP Engine’s site performance score evaluates whether a site’s typical performance meets customer expectations, and whether the site is well suited to handle unexpected bursts of traffic. We benchmark site speed against Google’s Page Rank recommendations, and compare site scalability to various other WordPress sites to compute the site score.
If your site sees typical web traffic, the site score is an indication of how well your visitors are served and consequently, how long they are likely to stay on your site and how likely they are to return. While a high score alone will not guarantee high page ranking, a low score will likely hurt your page ranking.
For certain types of sites the site score may be less relevant. This is especially true in instances where all site users require a log in, for sites that never experience viral traffic, or sites that do not prioritize high page ranking in search results. If your site falls into one of these more niche categories, you may choose not to rely on the site score as an overall indicator and instead focus on the individual metrics that are most relevant for you.
How the WP Engine Site Performance Score is Calculated
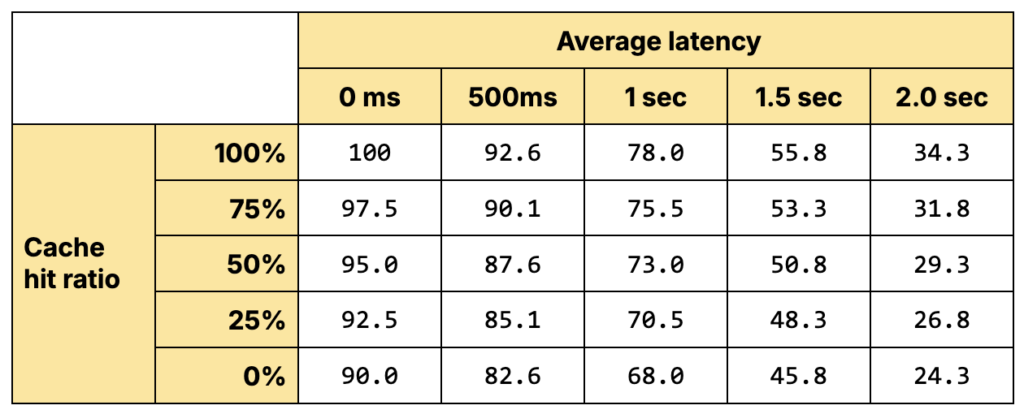
The site score combines your WordPress latency and your site cacheability.
Note
The latency is measured from our servers and not from CDN servers.
In order to determine your WP Engine site performance score we generate an underlying latency score and cache score over a 7-day look back period, and combine those metrics into a single value.
The minimum traffic threshold for a single day to have enough data to generate a score is currently 150 page requests. New sites will start showing a site performance score, 7 days after the first day that the site reaches the minimum traffic threshold.
The latency score is determined by a curve based on Google’s page scoring practices and further informed by our knowledge of unique WordPress performance characteristics. The score thresholds are based on Google’s thresholds for latency. The scores are designed using Google’s scoring practices.
The cacheability score is based on the percentage of page requests that are served from (Varnish) page caches. This is a simple ranking from 0 to 100.
The below table reflects how these two factors, latency and cacheability, are combined to derive an overall score. Please note that this distribution may change as we continue to evolve the score to better reflect the most relevant evaluation of site performance.
Steps to Improve the WP Engine Site Performance Score
For some sites, a fair site score might suffice. If reduced latency, improved ability to handle traffic spikes, and higher page rankings are important for a given site, then improving the site score is a good proxy to improving those aspects of your site performance.
Review the steps below for improving Average Latency and Cache Hit Ratio.
Page Requests During Busiest Hour
Page requests during busiest hour reflects the maximum number of page requests that your site received in the busiest hour of the last evaluated day. Higher concurrent page requests may require more site optimization or resources to serve traffic effectively.
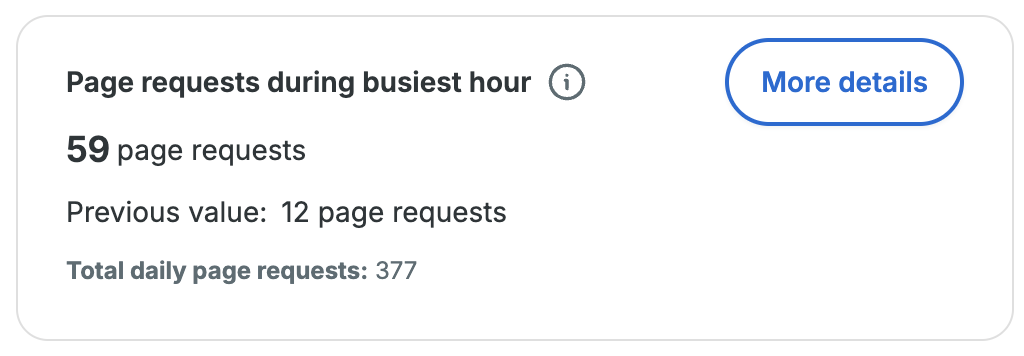
Why Page Requests during Busiest Hour is Important
Assessing page requests received during the busiest hour on your site is important to understand how to best scale your site, and to use as a potential indicator of unwanted bot traffic.
Scaling the site:
If a majority of your traffic is arriving over a few hours, then the hourly traffic will be a large percentage of the daily traffic. Sites that have a busy time of day need to be scaled to meet peak demand (much like designing roads to accommodate rush hour traffic).
Indicator of unwanted bot traffic:
Many websites receive the majority of their traffic from a limited number of timezones, so their traffic is naturally higher during certain times of the day and lower at others. It’s very rare for a website to have equal human traffic across all 24 hours of the day. If a site’s peak traffic hour gets close to 1/24 of daily traffic, it might be a sign that the traffic isn’t from real people. This would be a good time to check your access logs for unwanted bot traffic hitting your site.
How Page Requests during Busiest Hour is Calculated
We measure hourly page requests. For each 24-hour period, we take the highest hourly page requests number.
Note
Page requests are different from billable visits. Read more about billable visits here.
Steps to Improve Maximum Concurrent Page Requests
If your site is receiving a large number of requests during peak, it is important to make your site as efficient as possible. During high traffic, your caches should expire less often. If your cache hit ratio is low, find out why. For pages that are not served from cache, improve the page latency.
- Improve Average latency
- Improve Cache hit ratio
- Upgrading the server for your account is another way to improve this by increasing server resources
If your site’s peak traffic percentage is low, or starts to drop, look for additional signs that your site is receiving traffic that doesn’t convert to business. Are your Google Analytics not increasing with total traffic? Is your conversion rate dropping? Are you seeing a sudden increase in spam through contact forms? You may find the access logs provided in the WP Engine Portal helpful in identifying unusual traffic patterns. If you find unwanted traffic, you can add Access Rules on an environment’s web rules page, to block traffic based on certain conditions.
Detailed View for Page Requests
To view graphs and tables with more details about page requests, click the More details button next to the Page requests during busiest hour metric on the main performance insights page for an environment as shown below.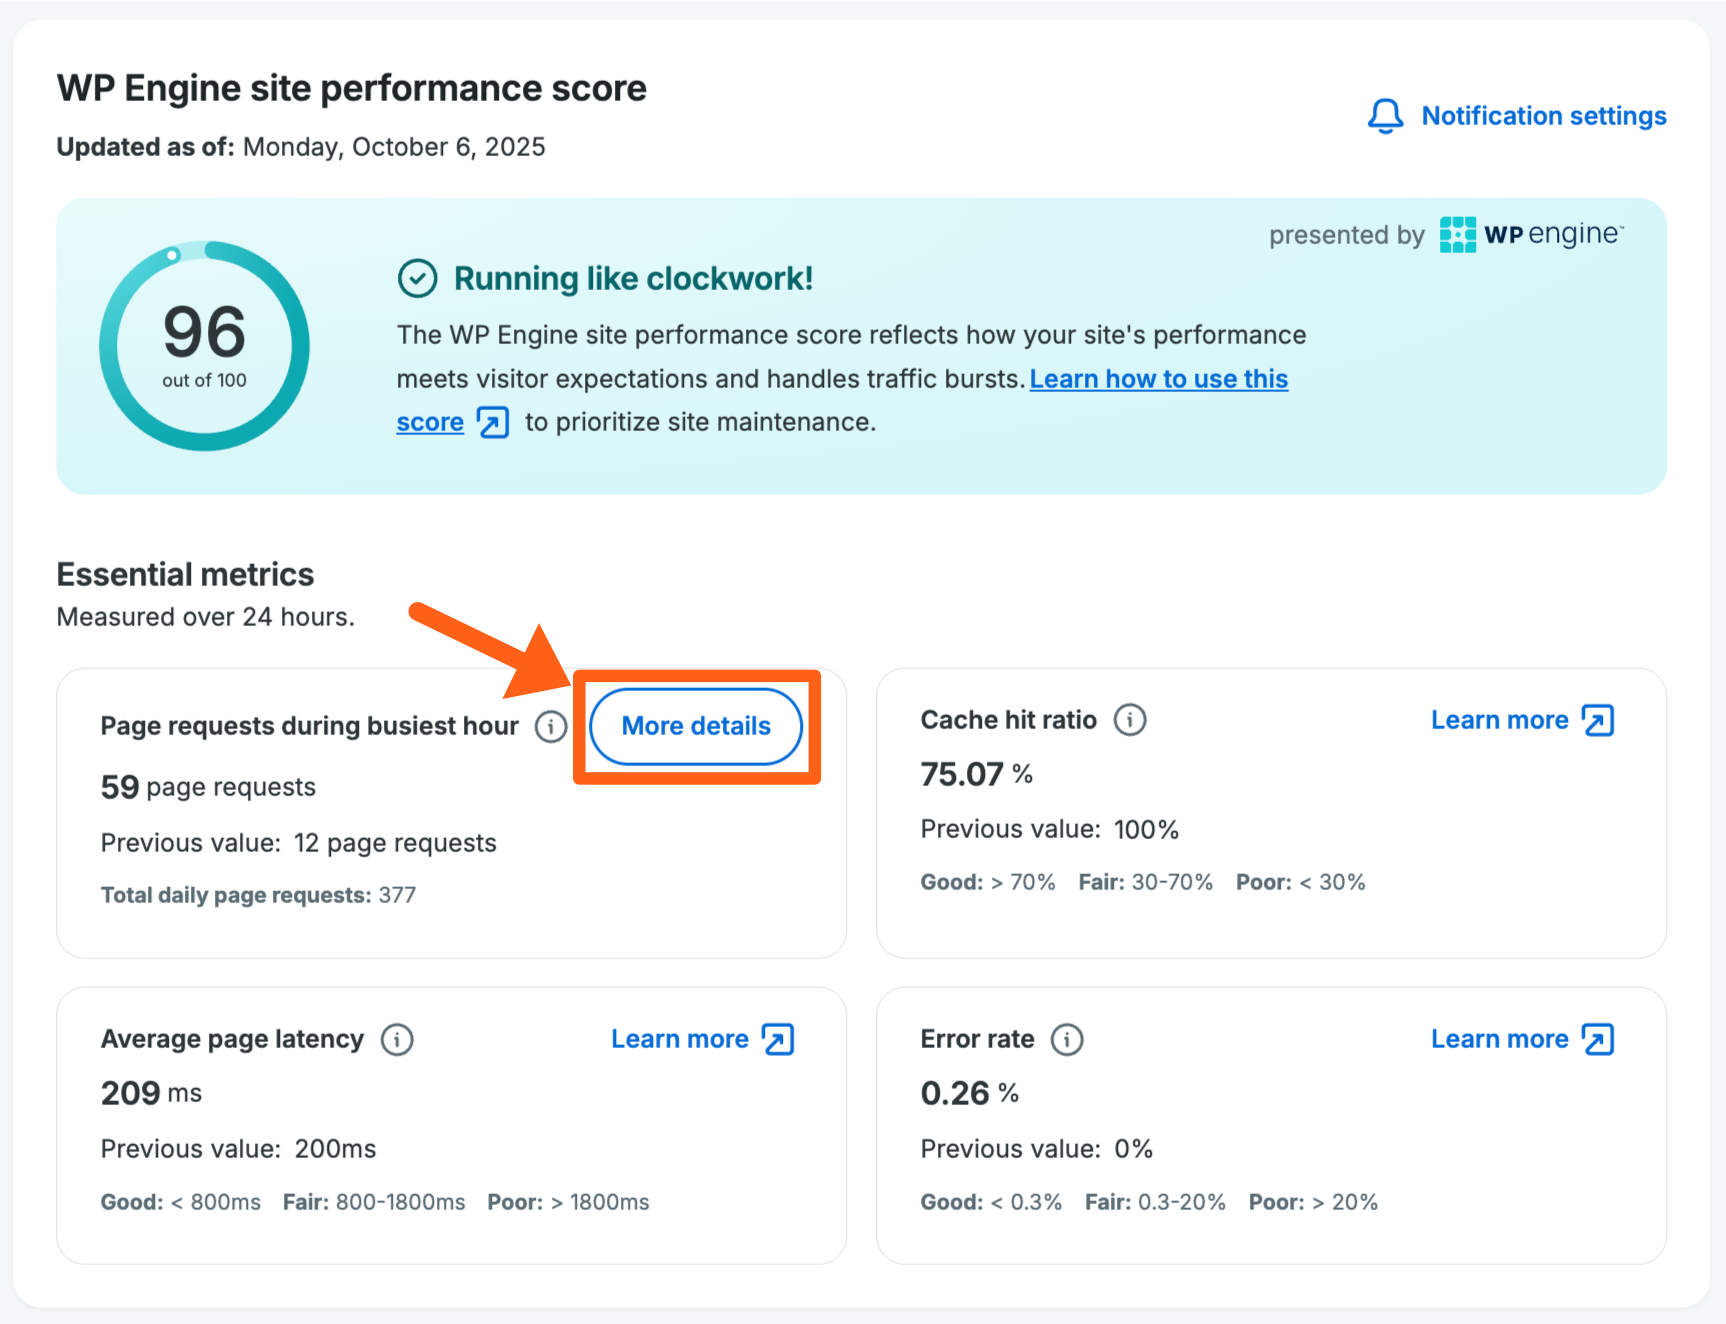
All graphs and tables can be viewed for a date range of up to 90 days. If you see a gap in information for some days, then there was not enough traffic on that day to reach our threshold for data to be collected.
Busiest Hour Vs Total
The busiest hour vs total graph compares the daily traffic total vs the busiest hour from the same day. This can help you to view traffic anomalies over a broad date range.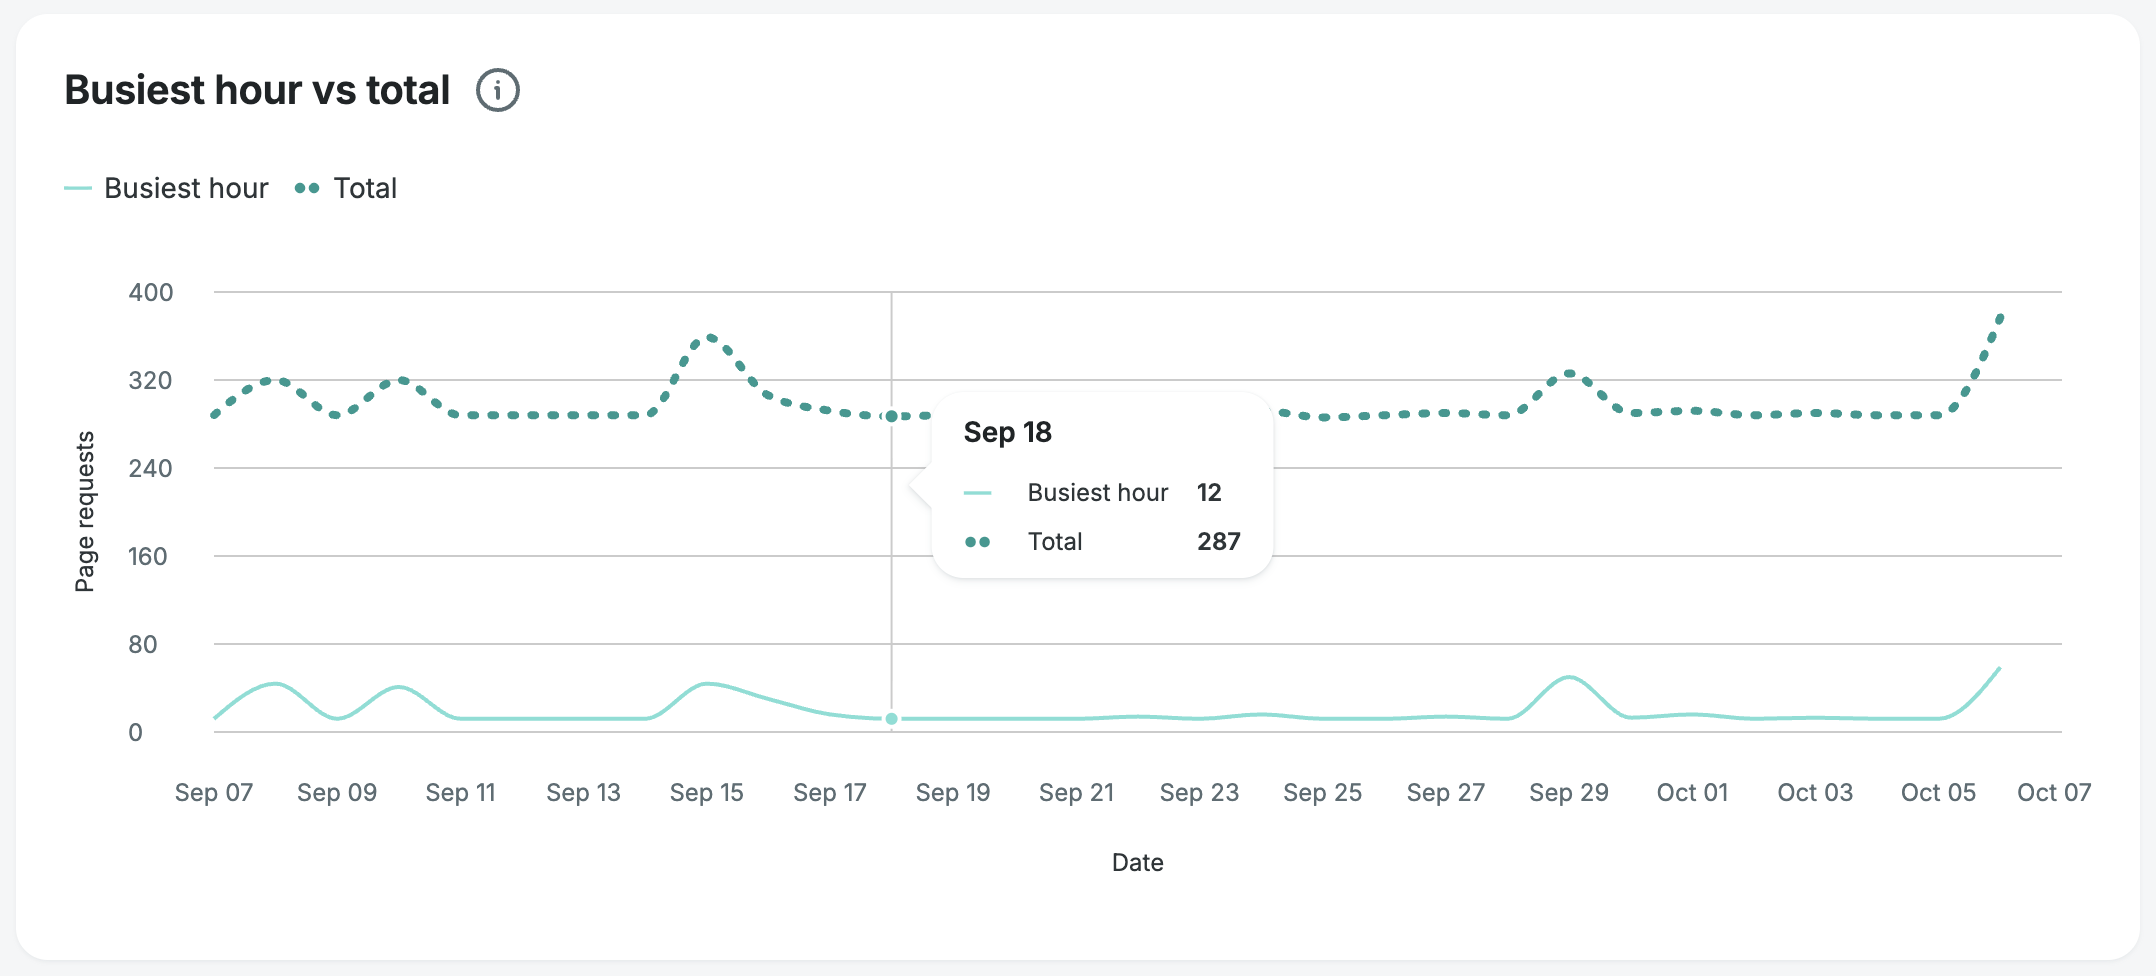
Page Requests by Day of Week
The page requests by day of week graph allows you to see which days of the week have the highest total traffic, and which days of the week have the highest average traffic, over your selected date range.
This can be helpful to you when scheduling events like marketing campaigns and website maintenance.
It can also be helpful in discovering potential unwanted traffic that only occurs on specific days of week. An example of this might be an intensive weekly scan from one of your own 3rd-party vendors that you do not want.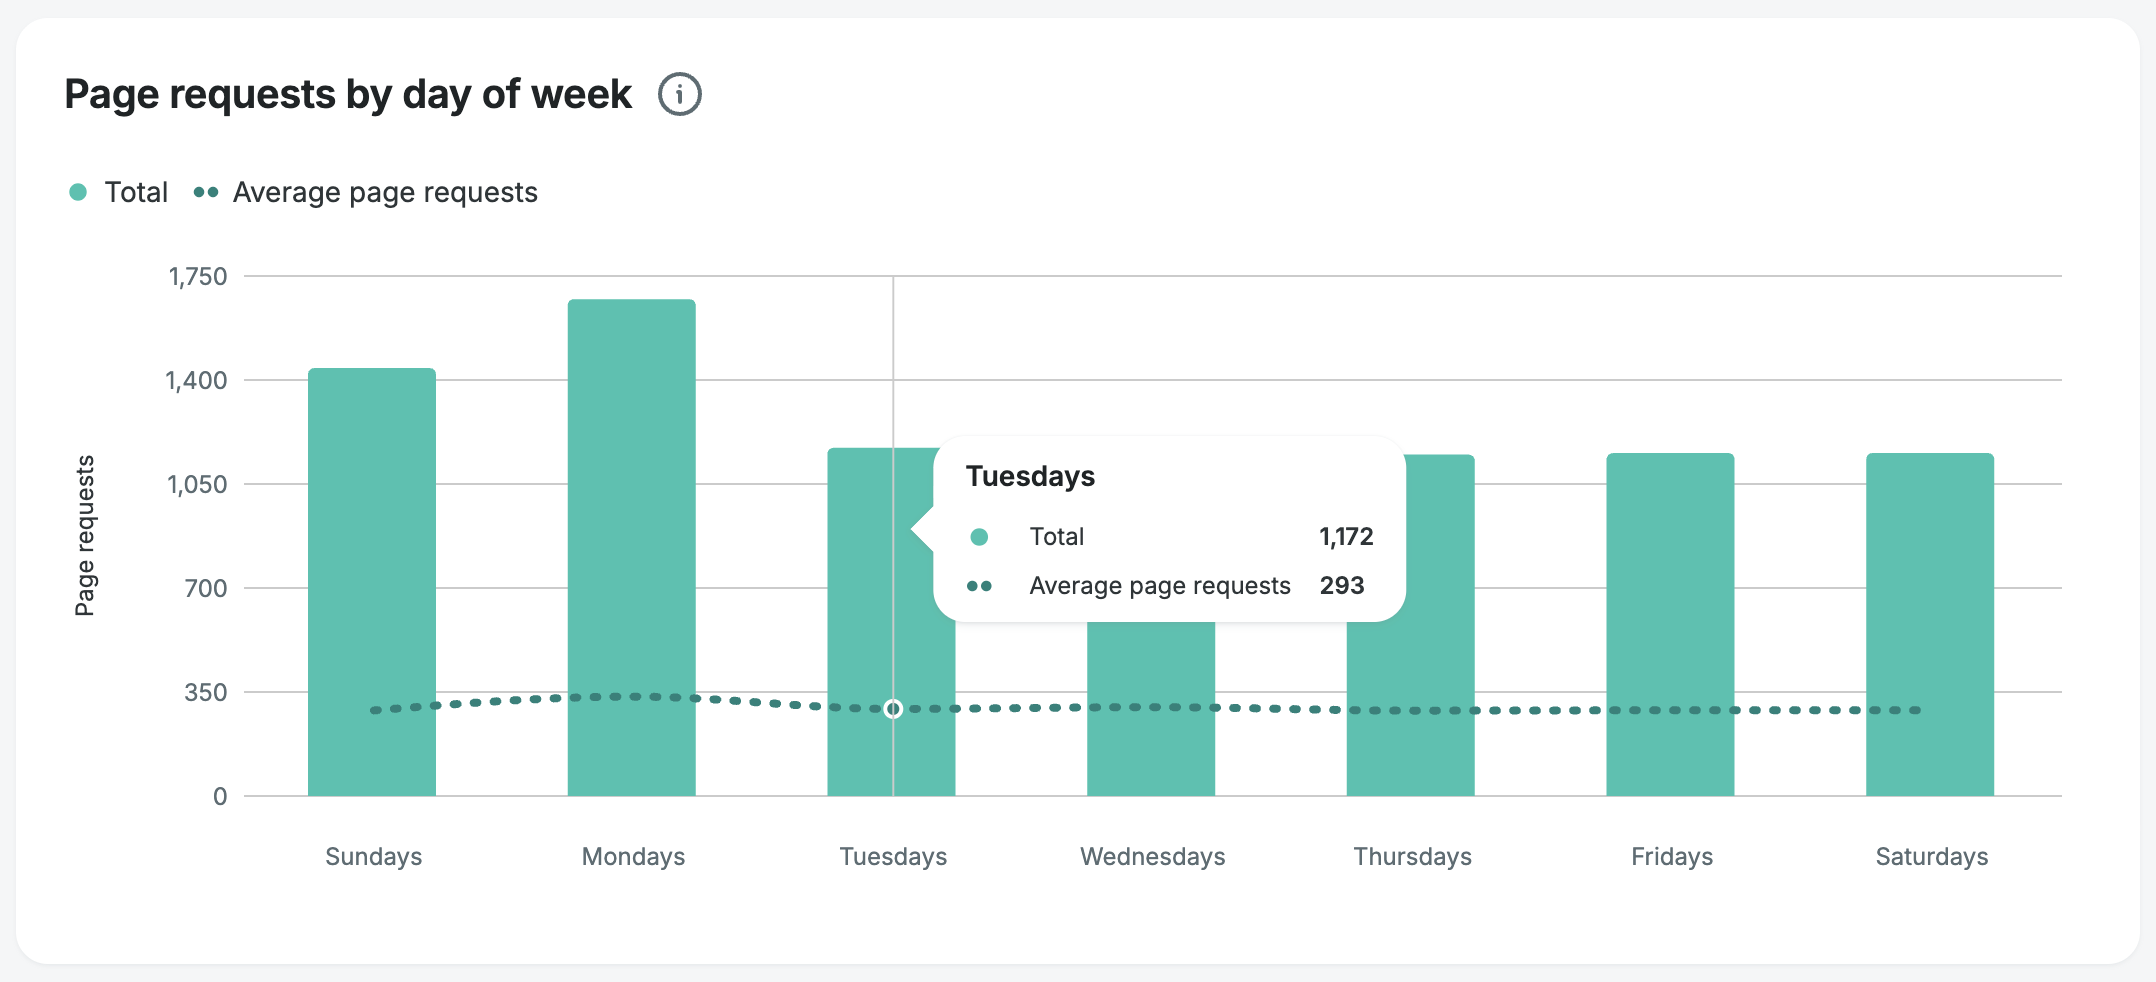
Total Page Requests by Country
The total page requests by country graph shows a heat map of the 20 countries with the most traffic over your selected date range. The darker countries have more traffic and you will see detailed numbers when hovering over each country. You can also see your data center location listed in the top right.
This information can be useful in discovering excessive traffic from unexpected regions. If you discover unwanted traffic, then you can choose to block traffic from specific countries with access rules.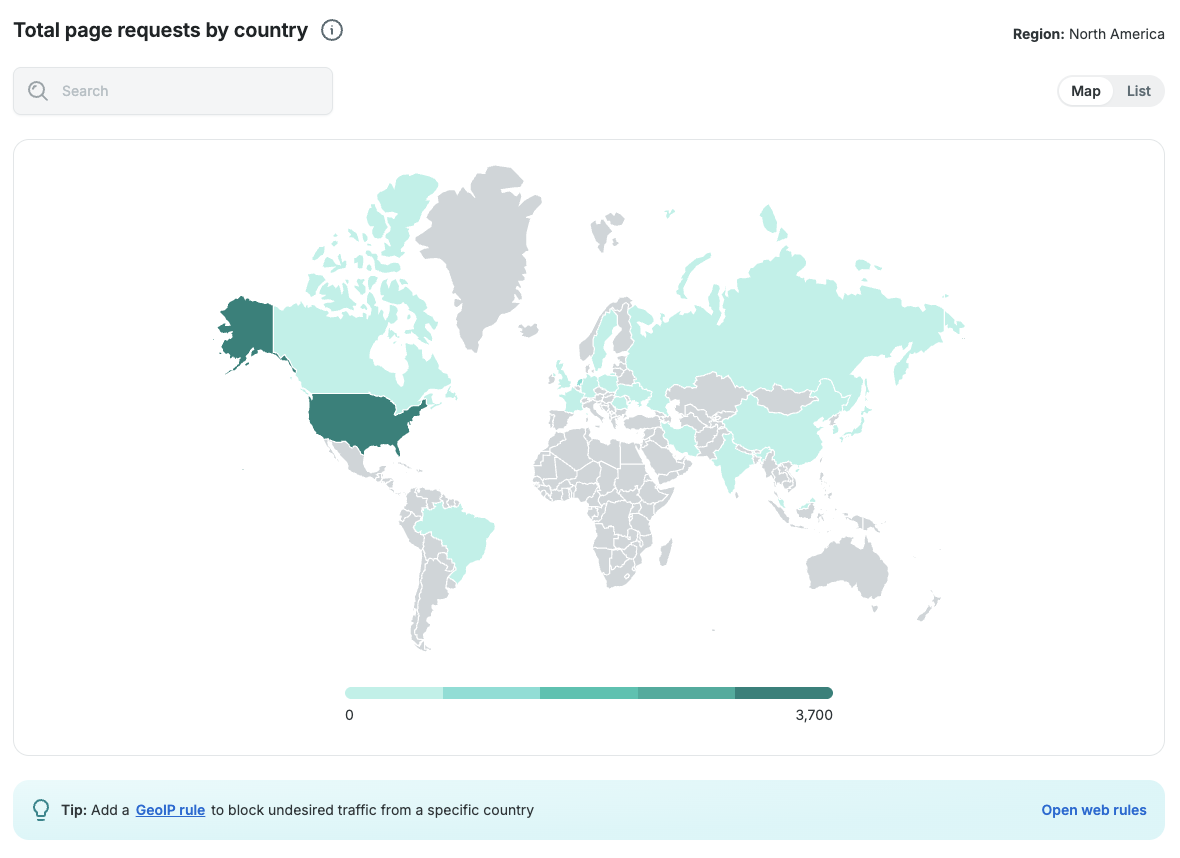
There is also a list view which shows a table with the same information. You can toggle the map and list view with the toggle switch in the top right.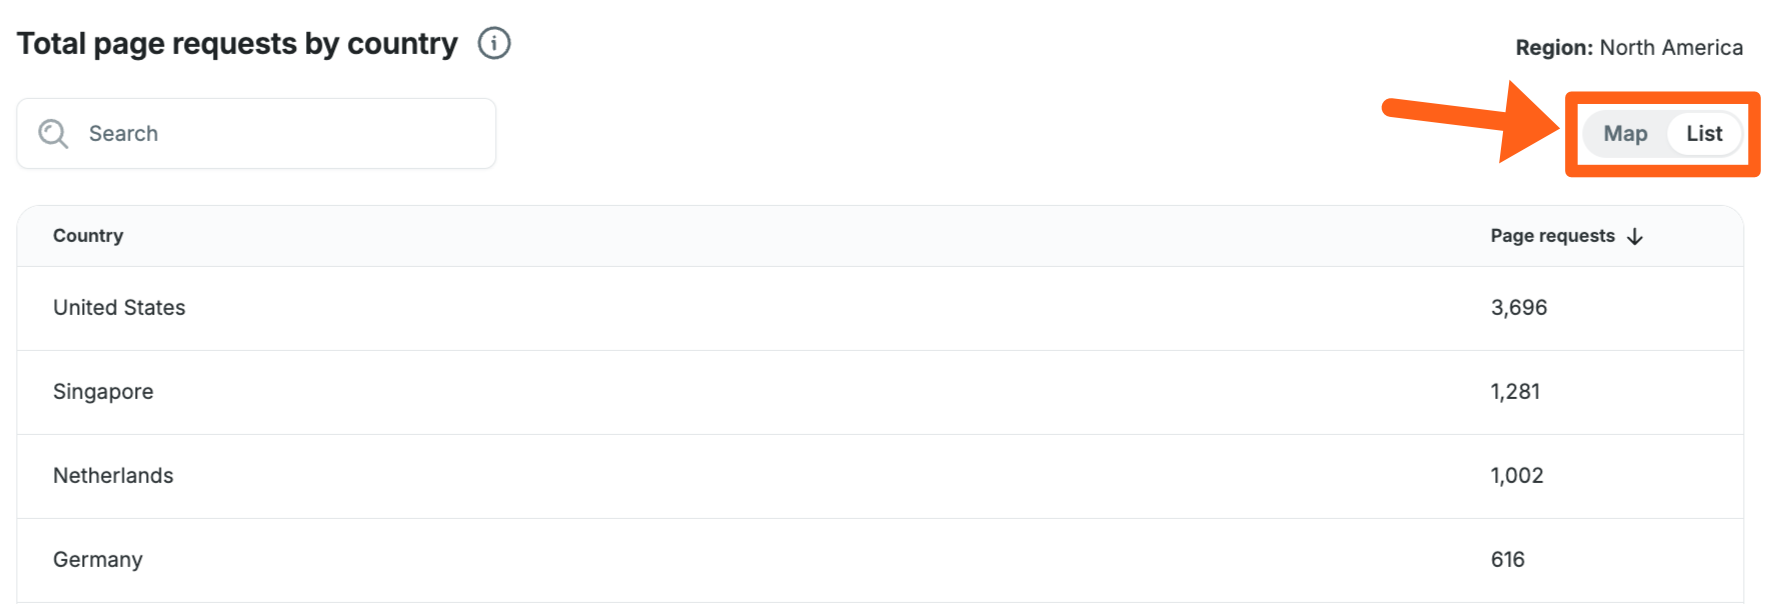
Top 5 Countries by Page Requests
The top 5 countries by page requests graph shows page requests for the 5 countries with the highest total page request count for the time range selected. You can see specific information about each day when hovering along each line on the graph.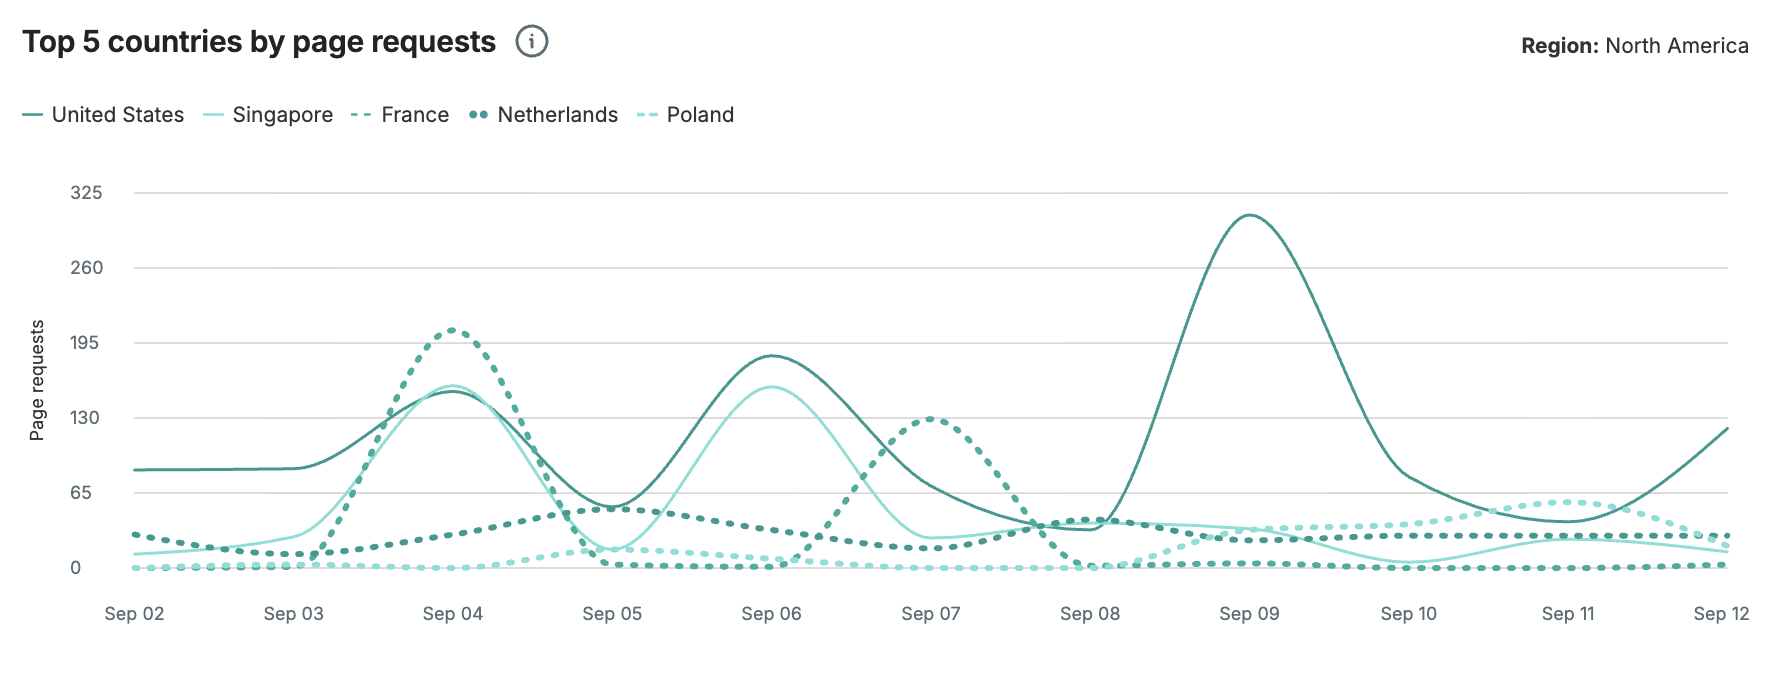
Average Latency
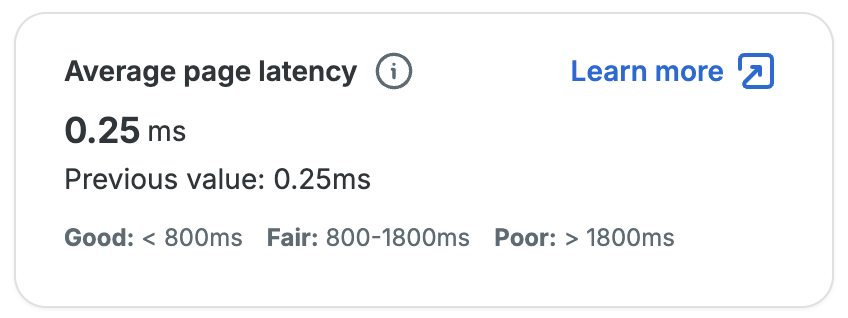
Average latency measures the average amount of time that it takes to serve a page on your site to a visitor. This is measured every 24 hours across all the pages receiving visits on your site.
Note
The latency is measured from our servers and not from CDN servers.
Why Average Latency is Important
Page latency is one of the primary determinants of visitor experience. Google considers this for their page ranking. This number is the most significant driver of the WP Engine site performance score.
How Average Latency is Calculated
Our system measures the time between the moment our servers receive a page requests request to when the last byte for the page has been sent out of our servers. Pages served from our caches see < 100ms latencies. We calculate this number daily, over a 24 hour increment for each site by averaging the latencies of all page requests. This approach naturally allows popular pages to influence the average more than rarely visited ones.
Steps to Improve Average Latency
- Improve plugin and theme performance
- Remove unnecessary plugins
- Adjust settings for plugins and themes that might increase page load times
- Improve the performance of custom PHP code
- Have a developer review any custom code that has been added for plugins or the website’s theme, to look for opportunities to remove un-needed code or to optimize code
- Improve database performance
- Sites with our eCommerce Performance Pack can take advantage of the slow query monitor to identify queries that are causing latency issues
- Use existing plugins for debugging database queries, such as Query Monitor
- Improve database cache hit rate
- Enable object caching which caches up to 1 MB of values for recent database queries
- Reduce the size of your database by removing un-needed content so that more of your database can be stored in memory. Core and Enterprise plans with dedicated servers can also be upgraded to a higher plan with additional memory
- Reduce queuing time by increasing PHP workers or reducing un-cached requests
- Increase cache hit ratio to reduce the number of requests that need to be processed with PHP
- Core and Enterprise plans with dedicated servers can be upgraded to increase the number of PHP workers and can handle more concurrent uncached requests
Cache Hit Ratio
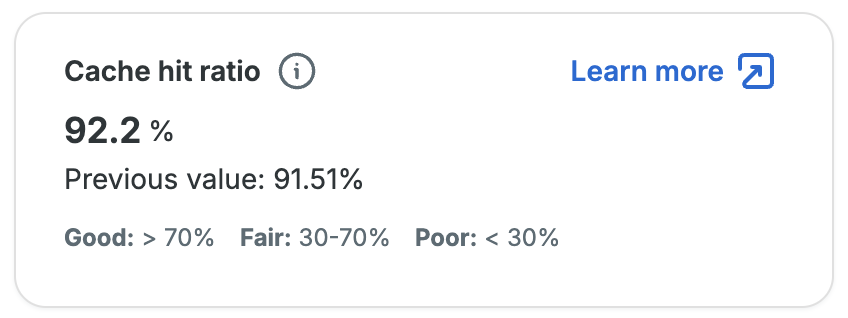
Cache hit ratio measures the proportion of visitor requests that are served from cache. Serving cached html for a page subtracts the time that it would take for the html to be re-rendered with PHP. This includes the time it takes for PHP functions to run, which also includes the time it takes to retrieve data from the database.
This metric is measured every 24 hours across all page requests across all pages on your site. This metric is specific to content served from Varnish page caches, which refers to the cache on the WP Engine server and not Cloudflare CDN cache.
Why Cache Hit Ratio is Important
Caching is a critical component of improving visitor experience on a site. A higher cache hit ratio can help reduce the load on PHP resources, enabling your site to serve content to more concurrent visitors quicker. Quicker response and load times correlate to decreased bounce rates, increased time on page and site, higher conversion rates and ultimately better SEO ranking.
Some sites will naturally have a low cache hit ratio. If your site falls into one of the following categories, a lower cache hit ratio is expected:
- Sites requiring logged in access for all pages
- Sites with Edge Full Page Caching enabled – cacheable requests are handled by Cloudflare’s CDN and don’t count towards this cache hit metric
- Sites functioning as the CMS backend for a headless site – headless sites only serve data from a WordPress database and don’t use WordPress’ PHP rendering for generating html
How Cache Hit Ratio is Calculated
This is the percentage of page requests served using our origin server’s cache. This refers to the caching on your WP Engine server. It is not looking at CDN cache used by our Advanced Network, GES or your own third-party CDN.
In other words, while hosting with WP Engine provides a variety of additional caching options that optimize visitor experience on your site, the cache hit ratio metric reflects what portion of page requests coming to the backend are served quickly and efficiently using caches.
Steps to Improve Cache Hit Ratio
If yours is not one of the sites outlined above that would naturally have a low cache hit ratio but has a lot of static content and you are still seeing poor cache hit ratios, you may be able to improve its performance and scalability by:
- Go to the Cache menu for an environment and validate that all cache exclusion rules are necessary.
- Check whether any cache exclusion rules introduced while developing or debugging are no longer needed.
- Check whether cache exclusions are being triggered based on a cookie or query parameter that is not used for personalization.
- If the cookie/query parameter is not used for personalization, you might be able to remove the rule.
- If a personalization parameter is being attacked by a bot that is sending invalid values, you can add an Access Rule to try to block the unwanted bot traffic. You can add rules to reject traffic from a region, a User-Agent, or an IP address.
- Go to the Web Rules page and validate that all cache exclusion Header Rules are necessary.
- These would include Header Rules with a name of
Cache-Control
- These would include Header Rules with a name of
- Enable Edge Full Page Cache.
- This will not necessarily improve our cache hit ratio score since we do not measure it from edge CDN servers, but it is an additional option for speeding up the time it takes to deliver page content to your visitors.
- Increase the cache length times for post types in the WP Engine caching menu of the WordPress dashboard.
- The path for the caching menu in the WordPress dashboard is
/wp-admin/admin.php?page=wpengine-common&tab=caching
- The path for the caching menu in the WordPress dashboard is
Error Rate
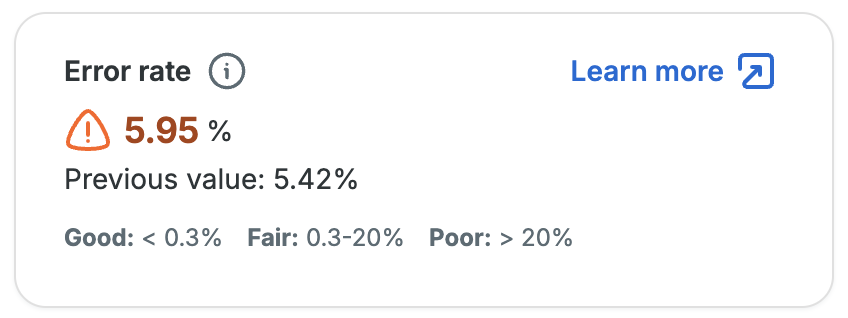
The error rate measures the proportion of visitors to your site that receive an error on the page they are visiting. This reflects instances where visitors were unable to access what they were looking for on your site. This metric is measured every 24 hours across all pages on your site. This excludes: intentionally blocked traffic, cron and bot traffic, admin and rejections due to security reasons.
Why Error Rate is Important
If a page on your website is receiving errors, it could be causing an increase in page load times or it could be breaking functionality on the page that is not apparent simply by looking at the page. Either of these can degrade performance for a web page and reduce trust by visitors.
How Error Rate is Calculated
We look at all the response codes to page requests. We don’t count requests for static assets (e.g. image links). We only look at requests for site content; we ignore wp-cron and wp-admin traffic. Certain errors while serving those pages are included in the error count, and we report the error count as a percentage of page requests.
The errors we include are:
- 404 – “Not Found” – Your site, or an external site, linked to a non-existent page
- 410 – “Gone” – The page requested no longer exists
- 429 – “Too Many Requests” – Your site is overloaded with requests leading to a visitor being served an error
- 500 – “Internal Server Error” – Your site’s backend failed. Usually a plugin’s code or custom PHP generated an error, which our servers translated to these.
- 502 – “Bad Gateway” – Usually reported by our WP Engine’s own server technology when the underlying plugins or code is running too long. Learn more about 502 errors on WP Engine.
- 504 – “Gateway Timeout” – usually reported by WP Engine’s own server technology when there are too many other pending requests for this request to be served before timeout. Learn more about 504 errors on WP Engine.
Steps to Improve Error Rate
The specific steps to resolve errors occurring on your site will depend on the errors you are experiencing. You can use the access and error logs provided by WP Engine to identify the most recent errors on your site and begin targeting them.
To check for all error types you can view the access logs. You can use the Filter button pictured below to narrow down the results you see. In the filter side drawer you can either select the Needs Attention checkbox to filter out successful responses, or you can scroll down and select specific error codes that you want to see.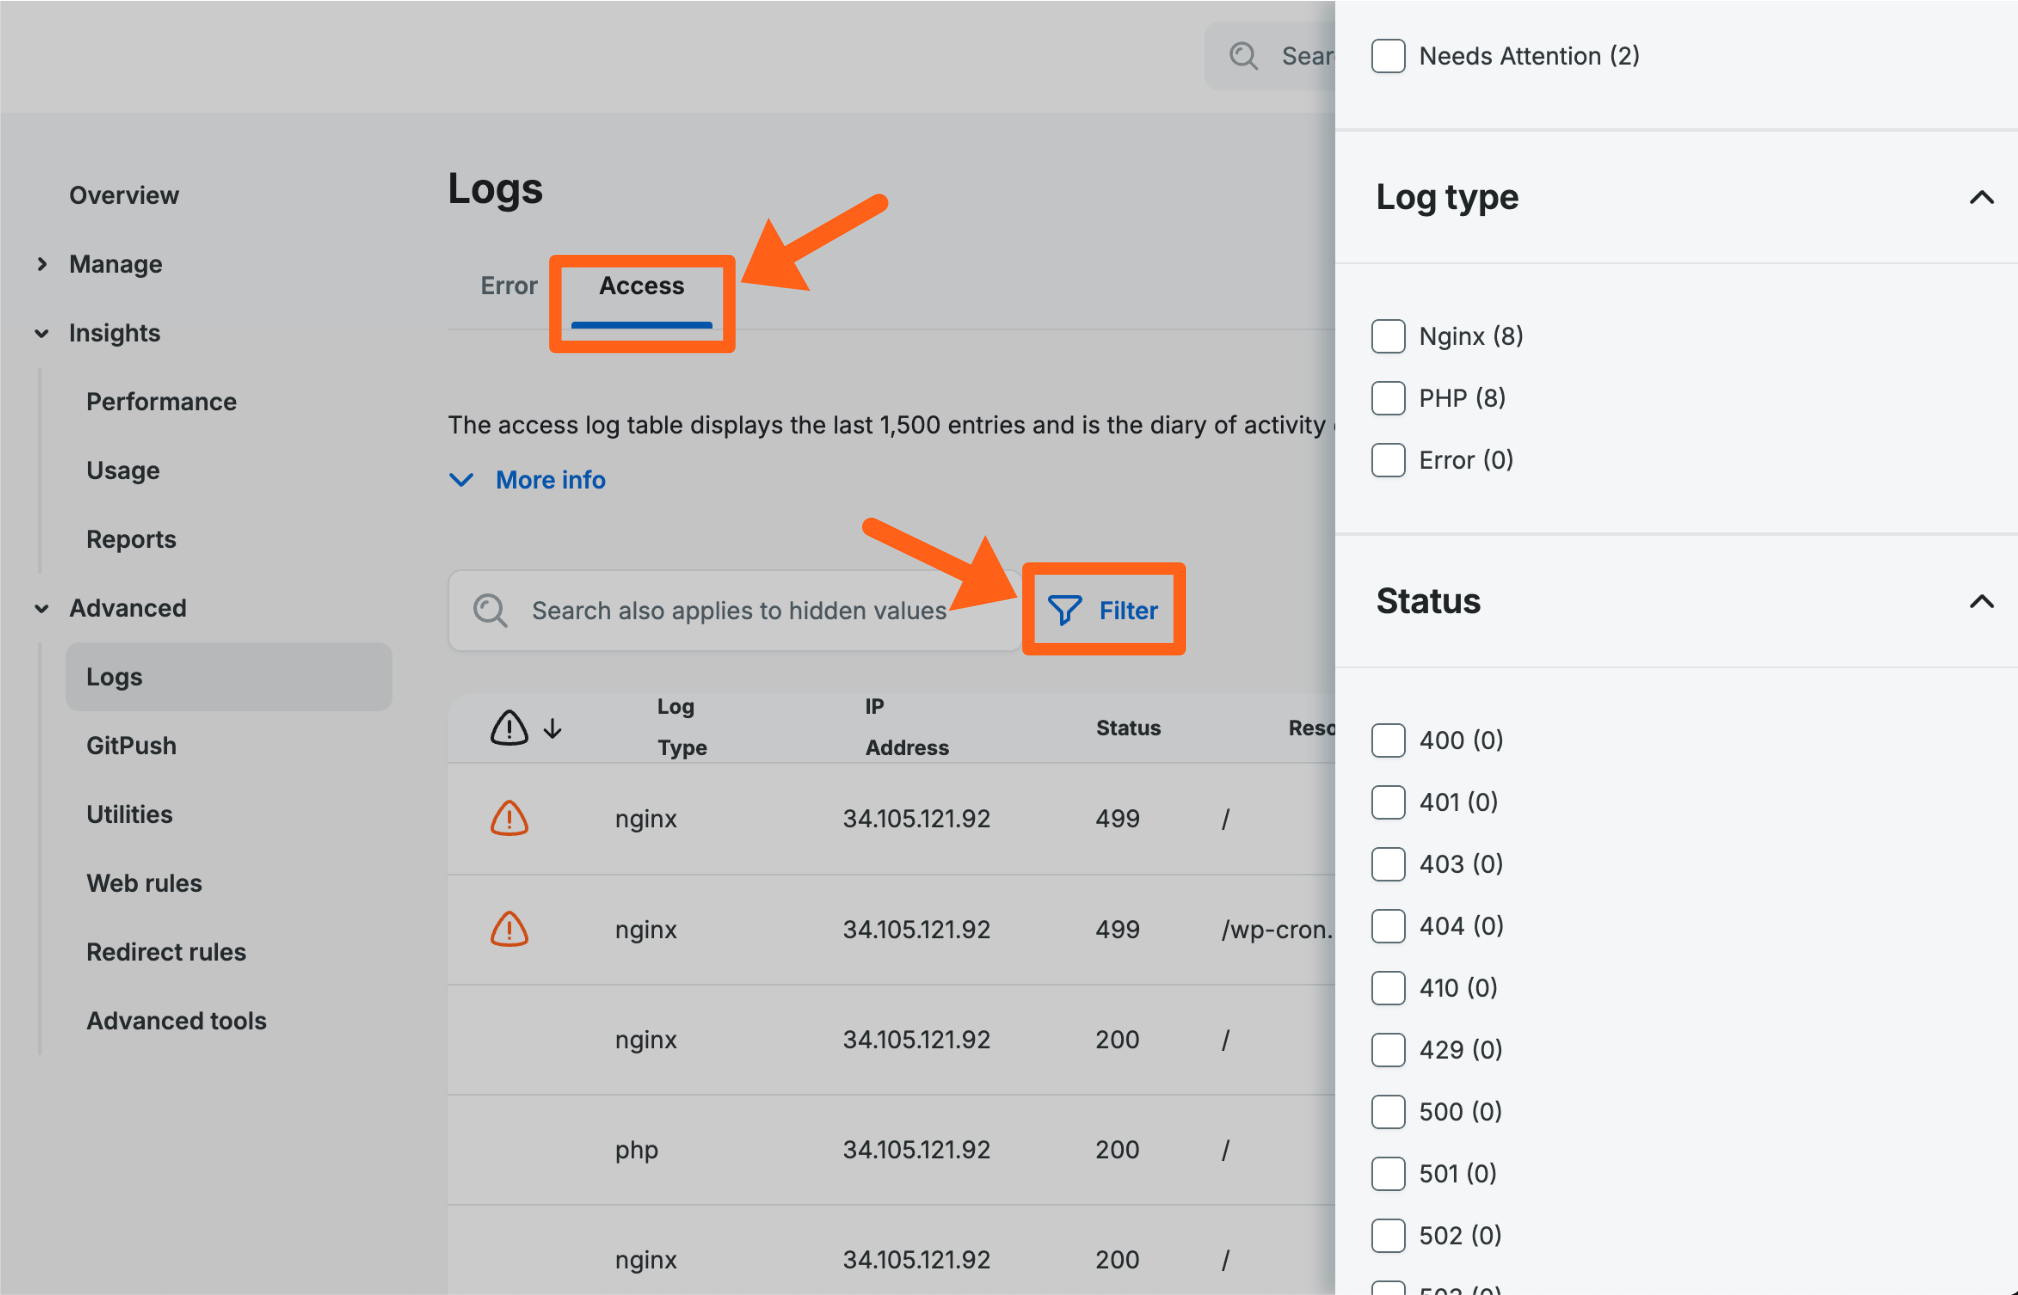
To see specific server errors like WordPress PHP errors, you can view the error logs. You can use the Filter button pictured below to select the Needs Attention filter. This should show only errors and filter out notices which are just warnings and not errors.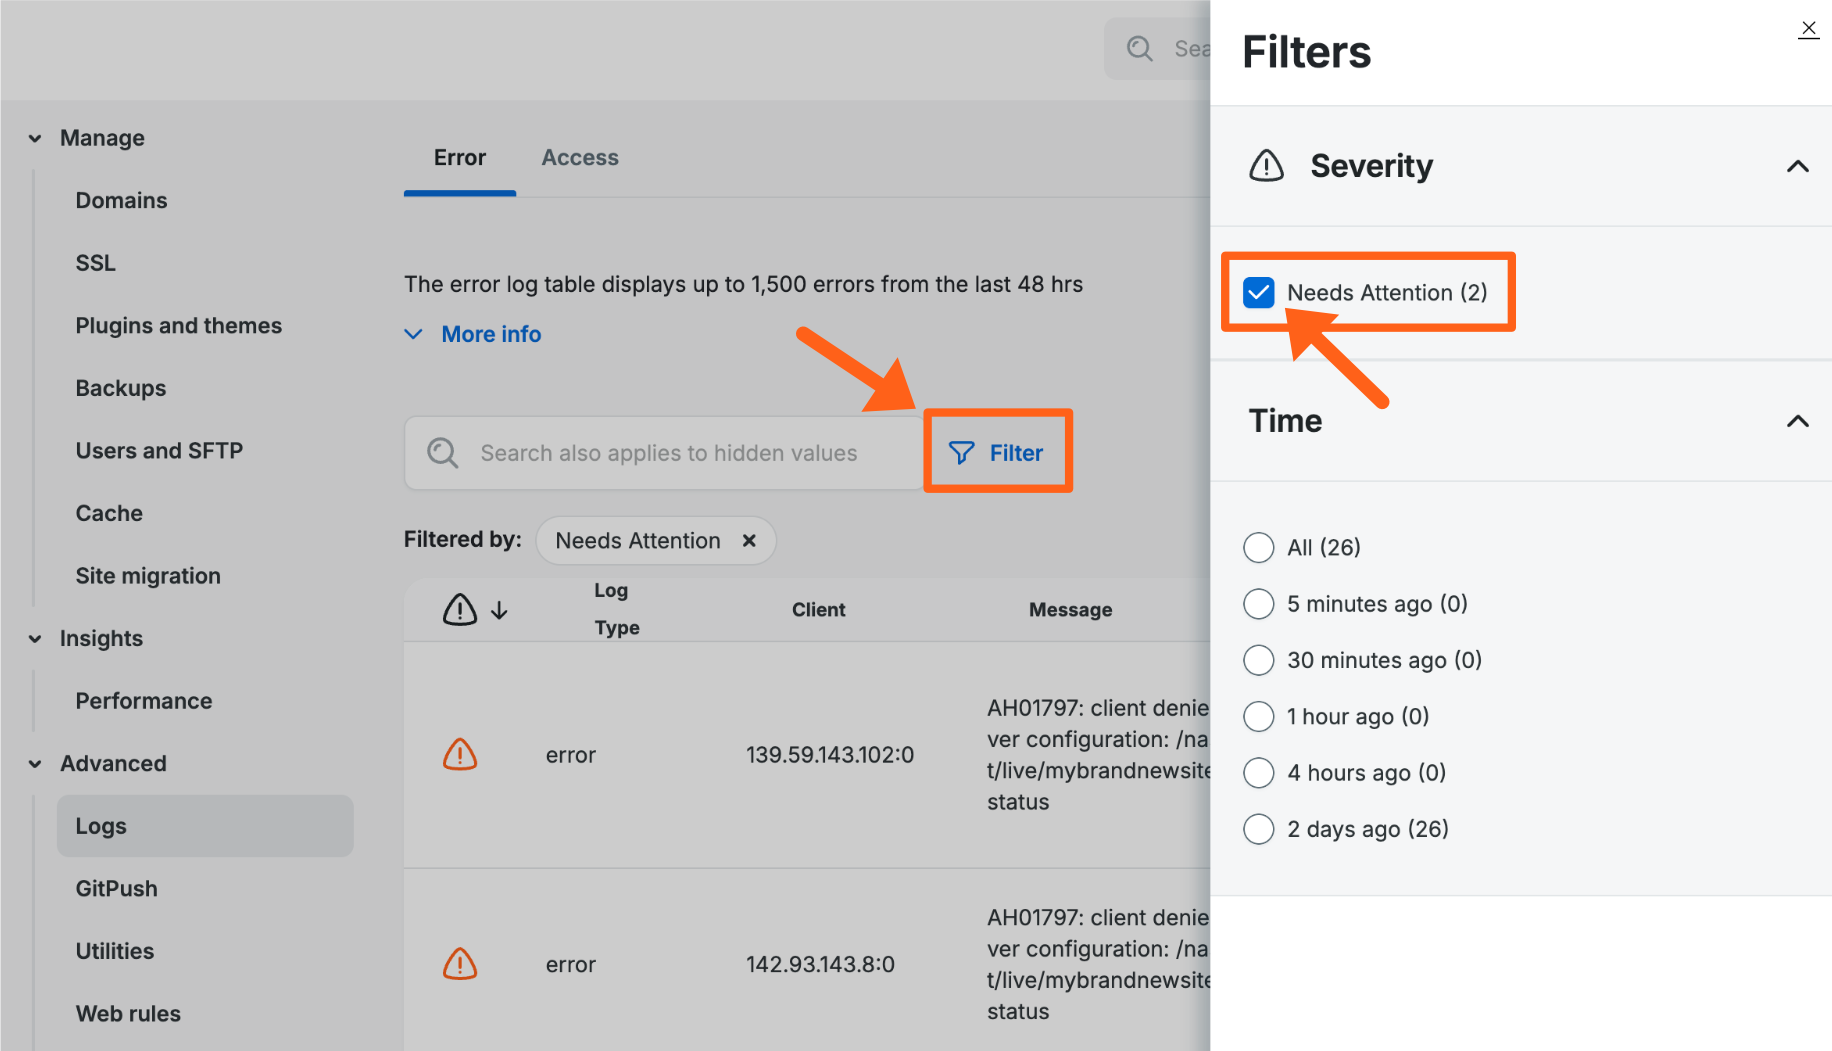
Consider if errors have increased disproportionately with traffic, as this may indicate that your site is being targeted by bots and may benefit from additional rules to filter unwanted traffic. You can leverage the Access Rules tab of Web Rules page to block unwanted visitors. Additionally, if your site is currently on our Legacy network for DNS, consider updating to the Advanced Network to take advantage of enhanced security.
You can also have error logs uploaded to your own Amazon S3 bucket each night if you want to retain the logs for your dev team to review. Read more about offloading logs.
Detailed View for Error Rate and Redirects
To view graphs and tables with more details about error and redirect status codes, click the More details button in the top right of the Error rate card on the main performance insights page for an environment as shown below.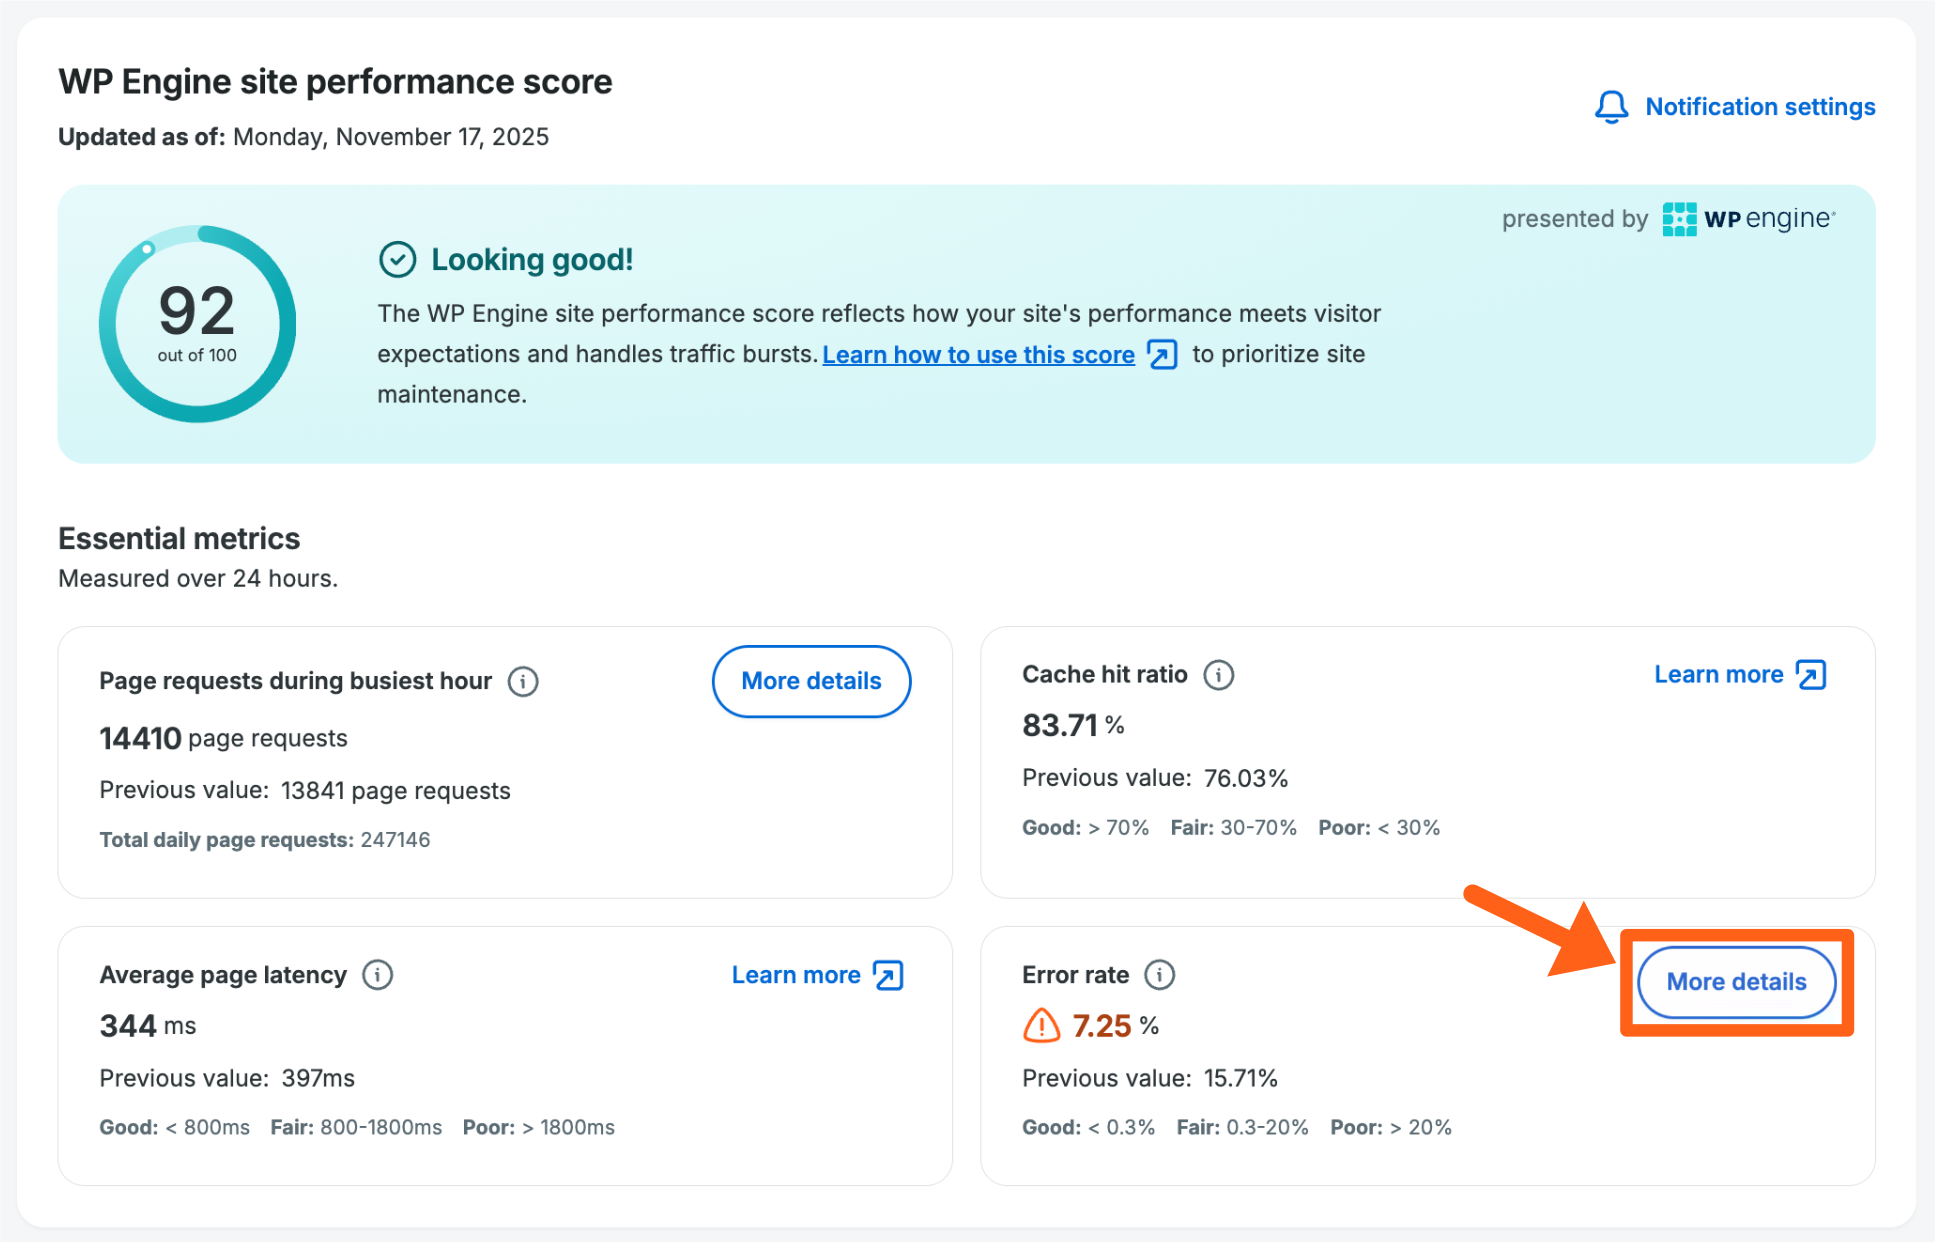
All graphs and tables can be viewed for a date range of up to 90 days. If you see a gap in information for some days, then there was not enough traffic on that day to reach our threshold for data to be collected.
The filter options include:
- Status codes – Choose from “All status codes”, or from status codes in the 300, 400, and 500 ranges (3xx, 4xx, 5xx).
- Date range – Choose from last 30 days, 60 days, 90 days, or custom.
Status Codes Breakdown
This graph shows an overview of each error code’s percentage of the total number of errors. When you have all statuses selected for the view option, then you will see the breakdown by the different status code ranges (3xx, 4xx, 5xx). 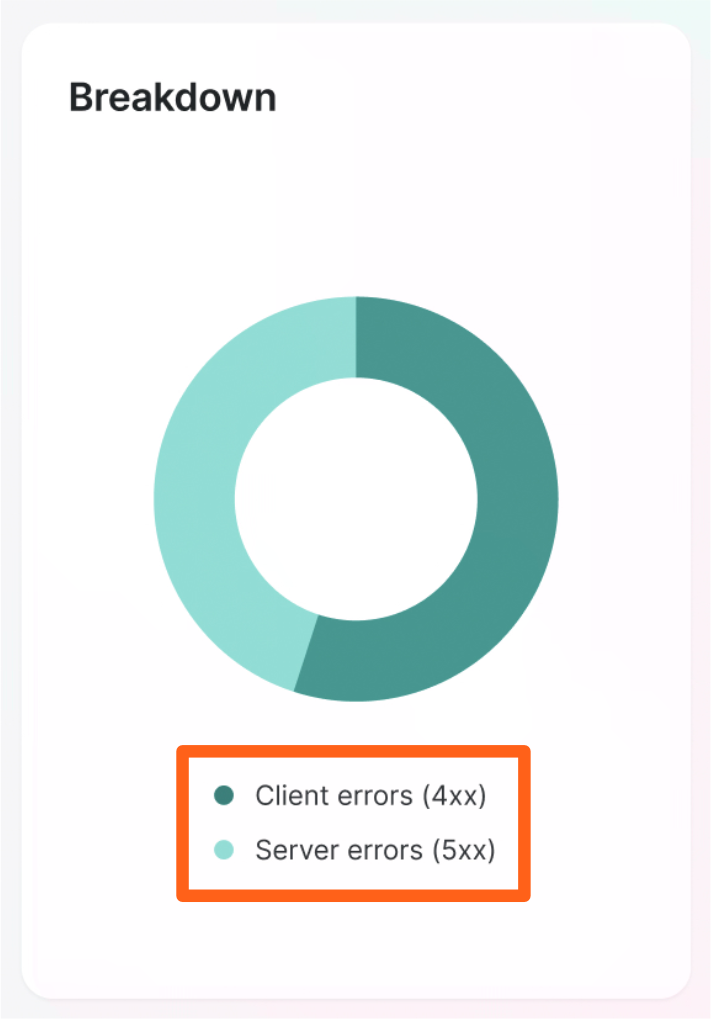
Status Code Trends
The trends graph shows either the count of each error code, or the percentage of each error code by day, for your selected date range. You can use the toggle switch in the top right to switch between count and percentage.
When you have all statuses selected for the view option, then you will see the breakdown by the different status code ranges (3xx, 4xx, 5xx).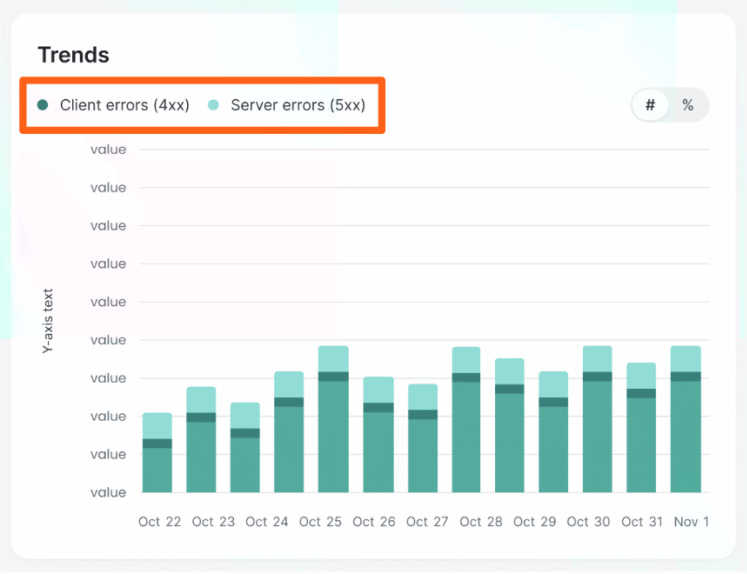
Status Codes by Country
The status codes by country section shows an overview of status codes for each country with a map view and a table view. To switch between the map and list views, use the toggle button in the top right.
When you have all statuses selected for the view option, then you will see the breakdown by the different status code ranges (3xx, 4xx, 5xx).
Map view (with all error statuses selected)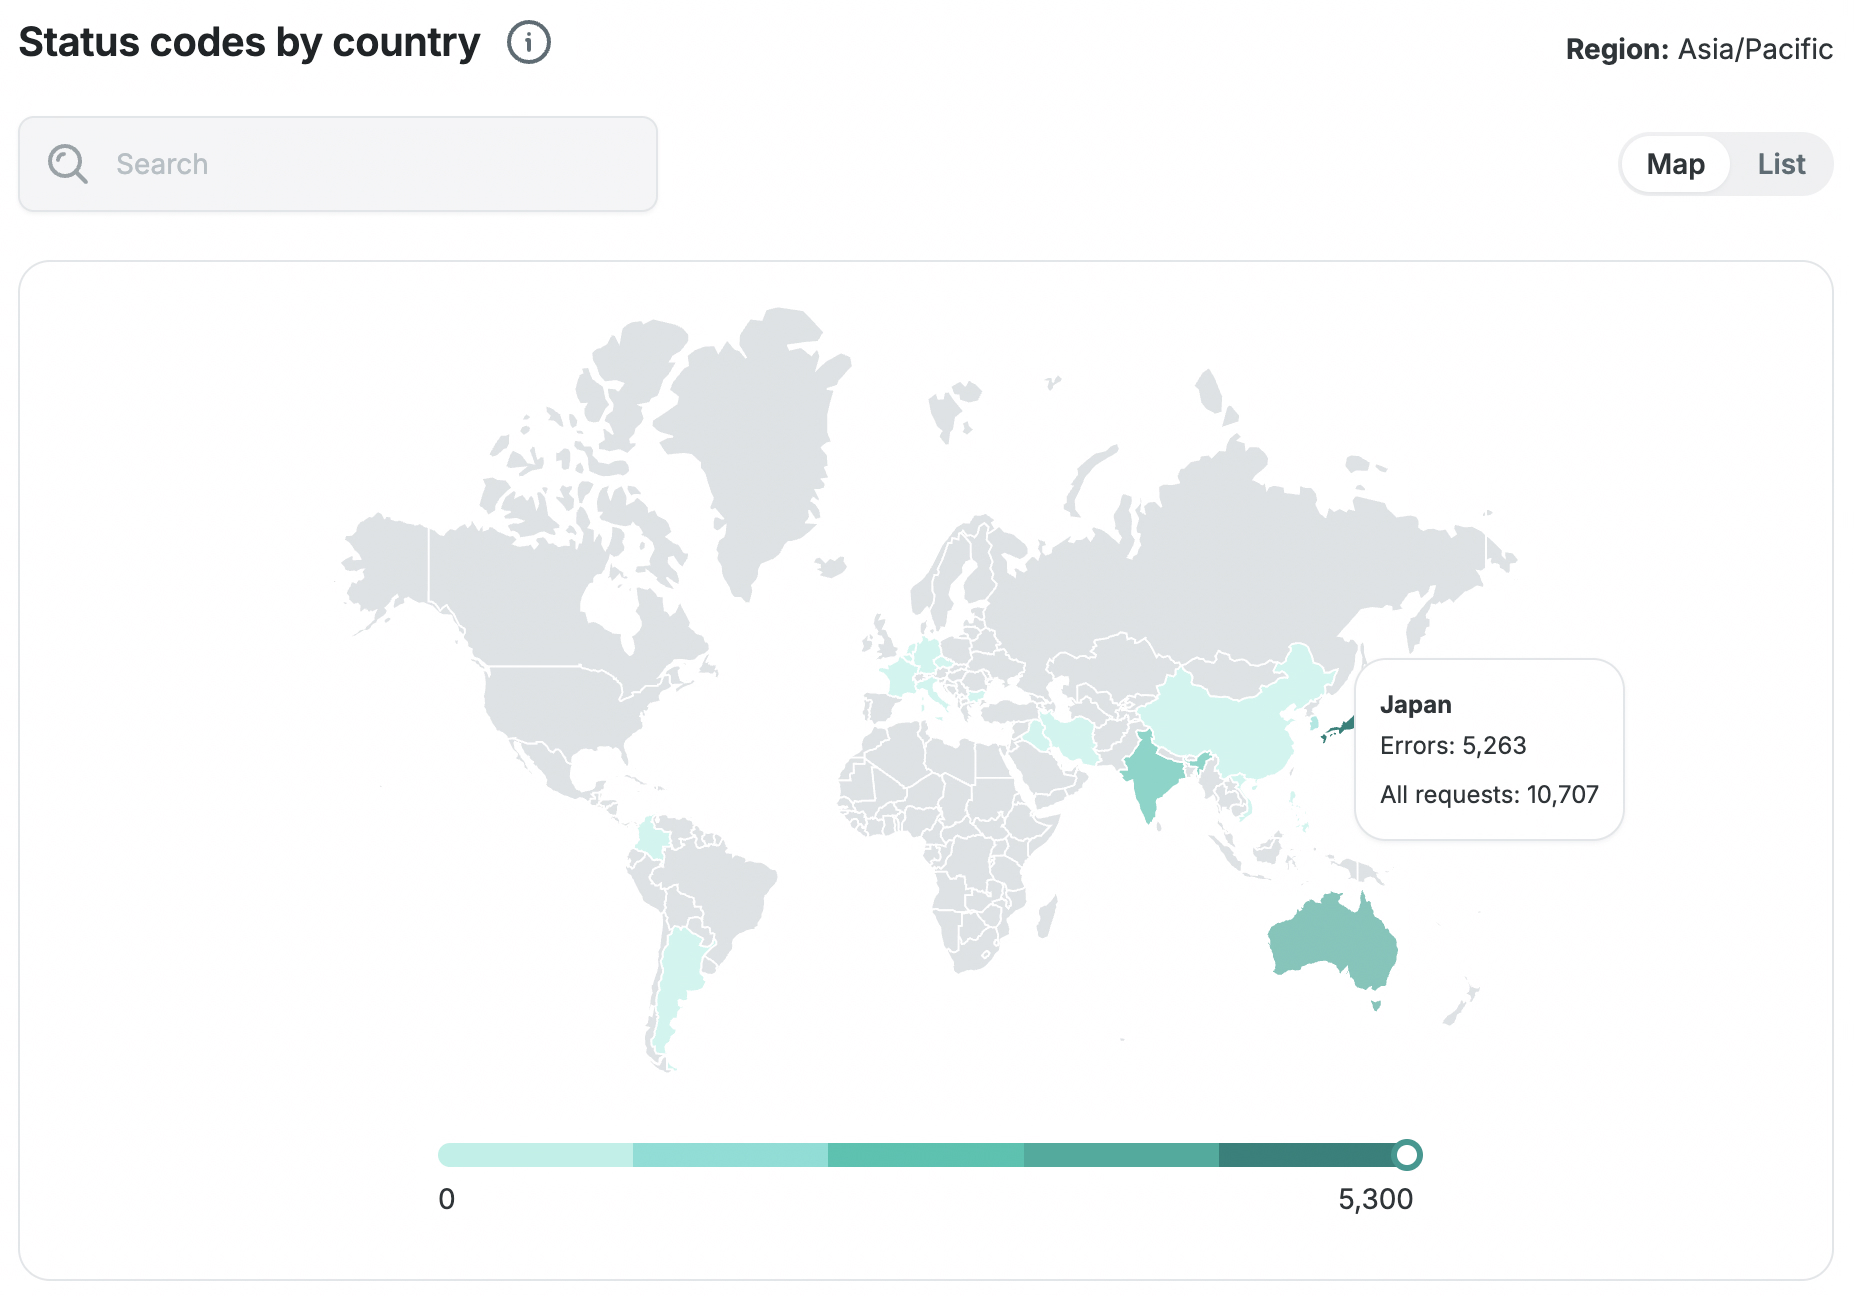
List view (with all error statuses selected)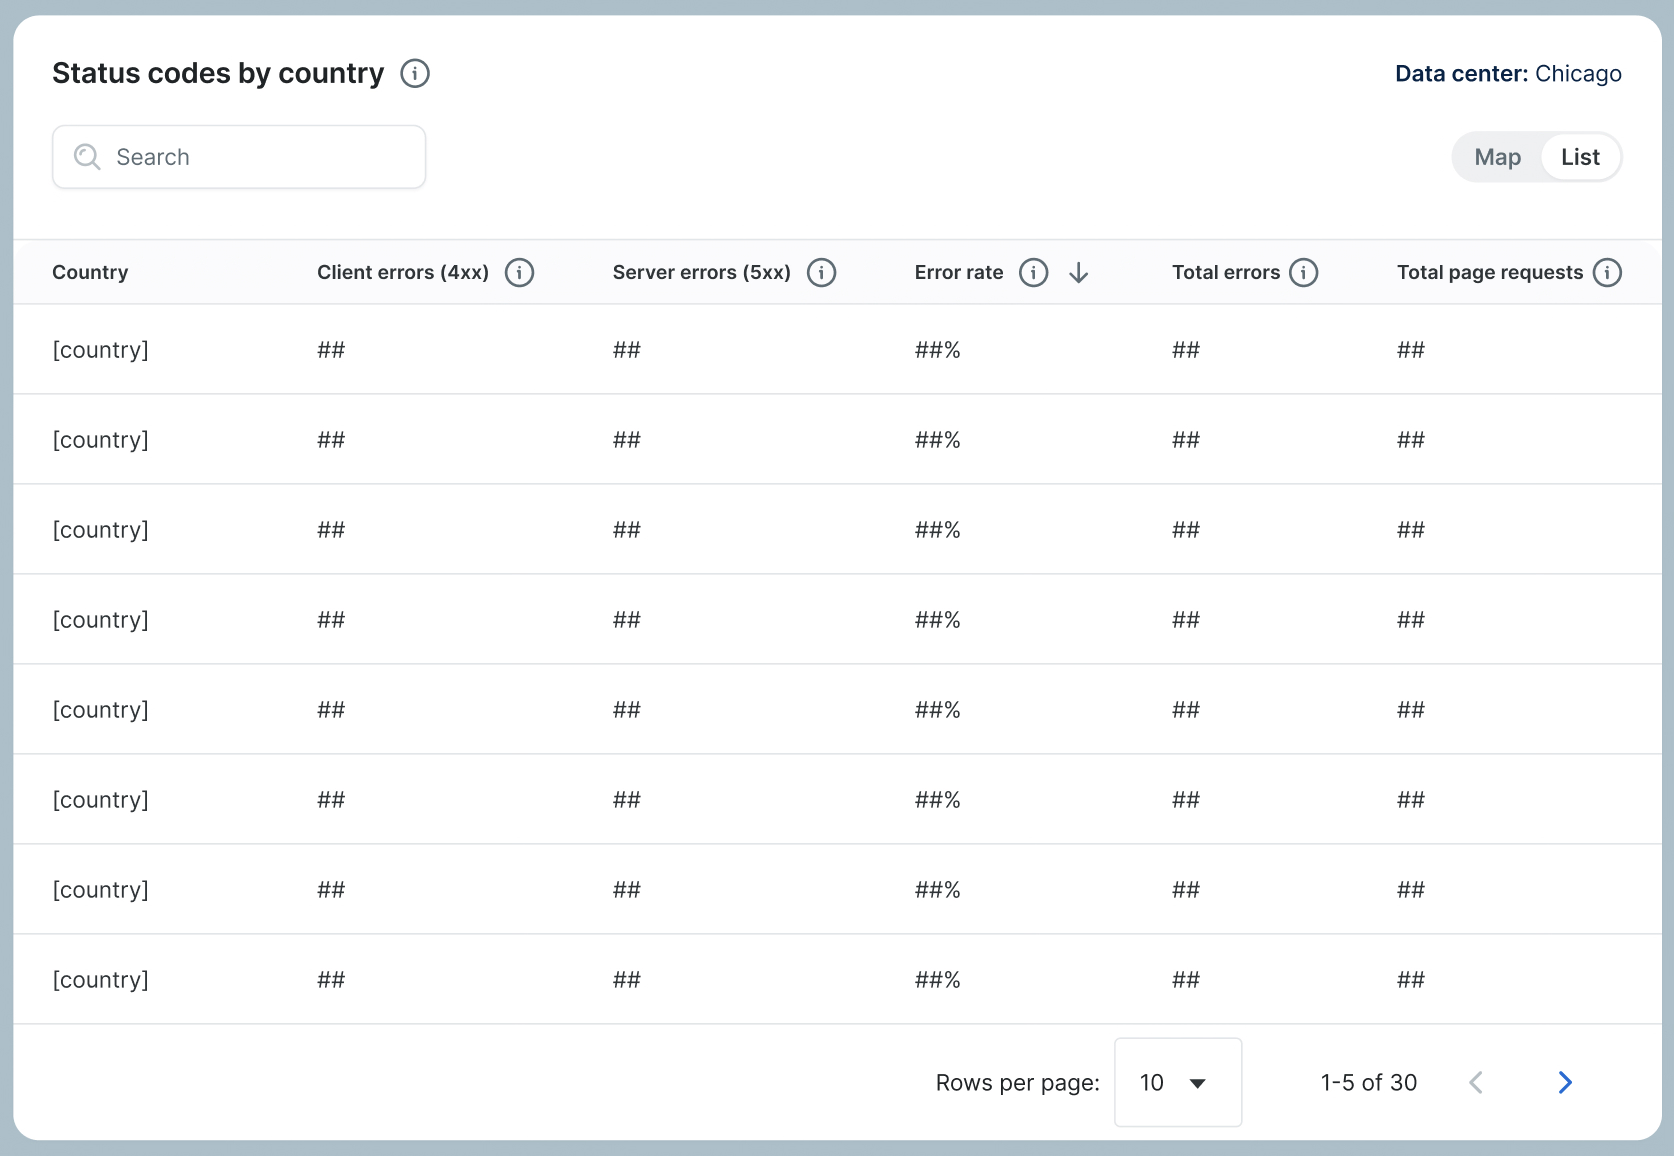
Status Codes by Page
The status codes by page table shows pages on your site that received the most error or redirect status codes when the pages were visited.
There are multiple page filters that you can select at the top of the Errors and redirects page. The table will show different information based on your filter selection:
- All error statuses: This filter shows status codes in the 4xx and 5xx ranges.
- All statuses: This filter shows status codes in the 2xx, 3xx, 4xx, and 5xx ranges.
Note: 2xx status codes show success and are shown so you can compare the amount of successful page loads to error and redirect page loads.
The following screenshot is an example of the table with the All statuses filter selected.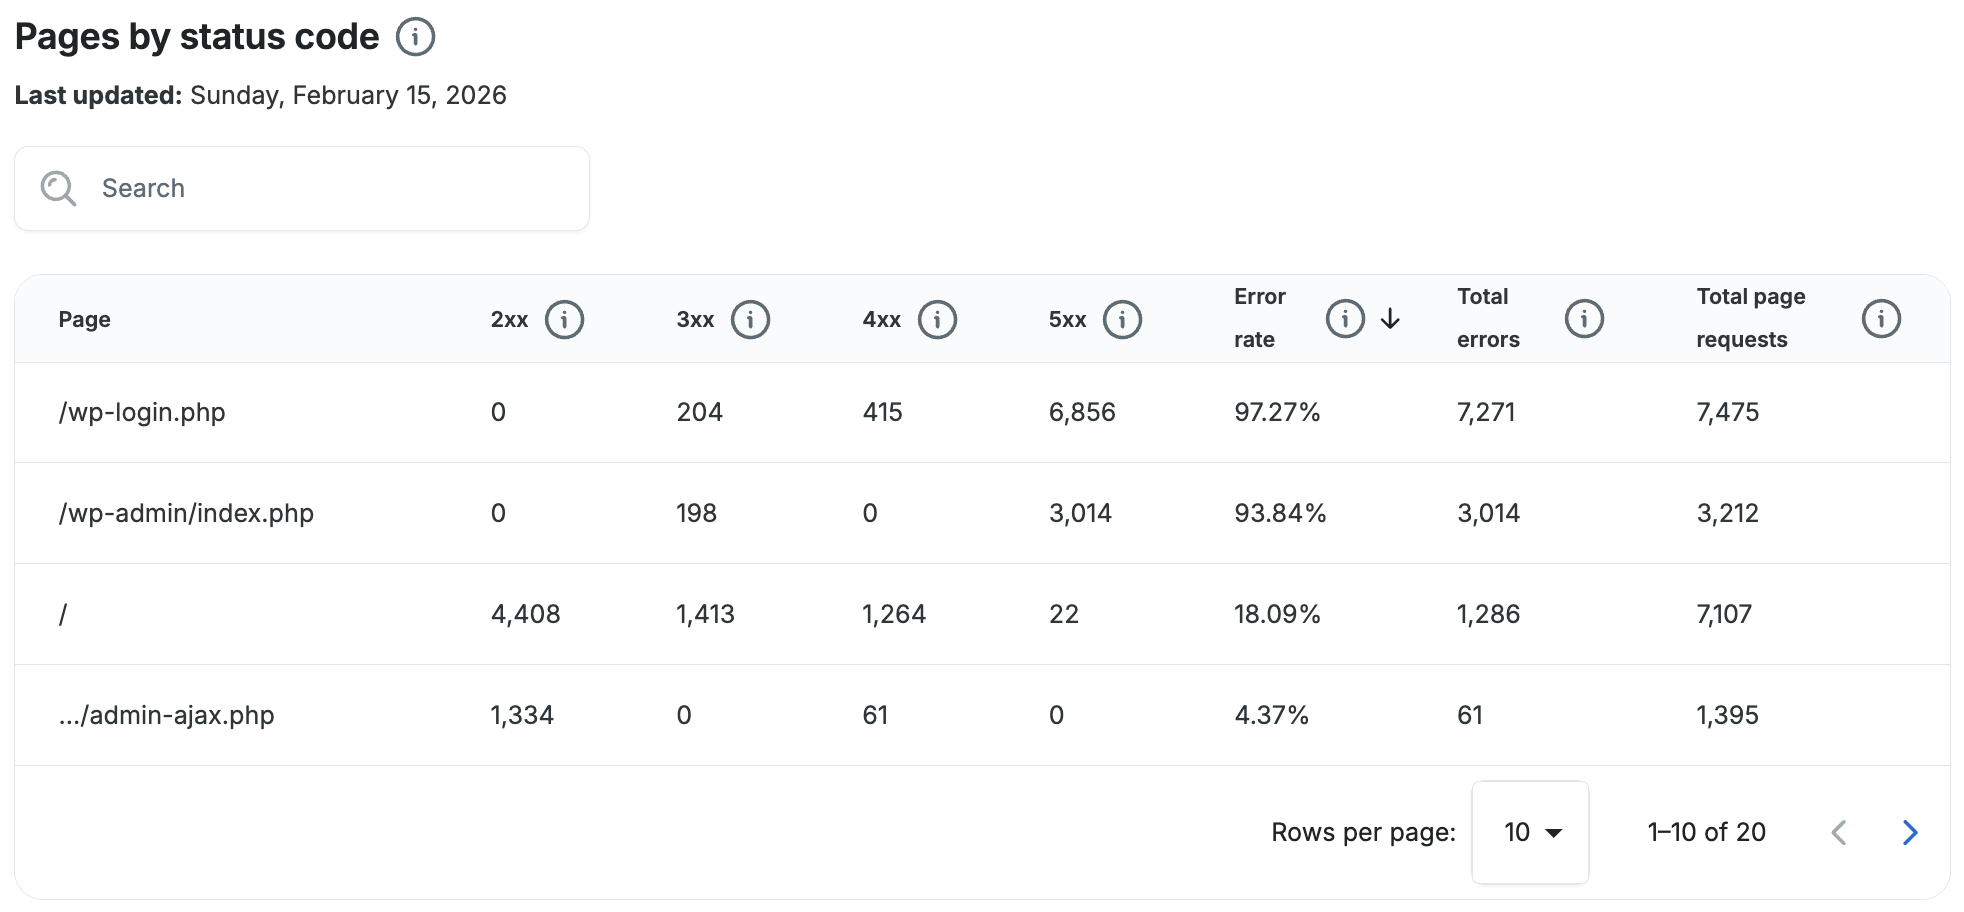
Metric Comparison
This graph lets you select 2 metrics to compare for a selected time range. This is a great place to begin analyzing how the above metrics relate to each other in order to hone in on the root cause of any performance issues on your site.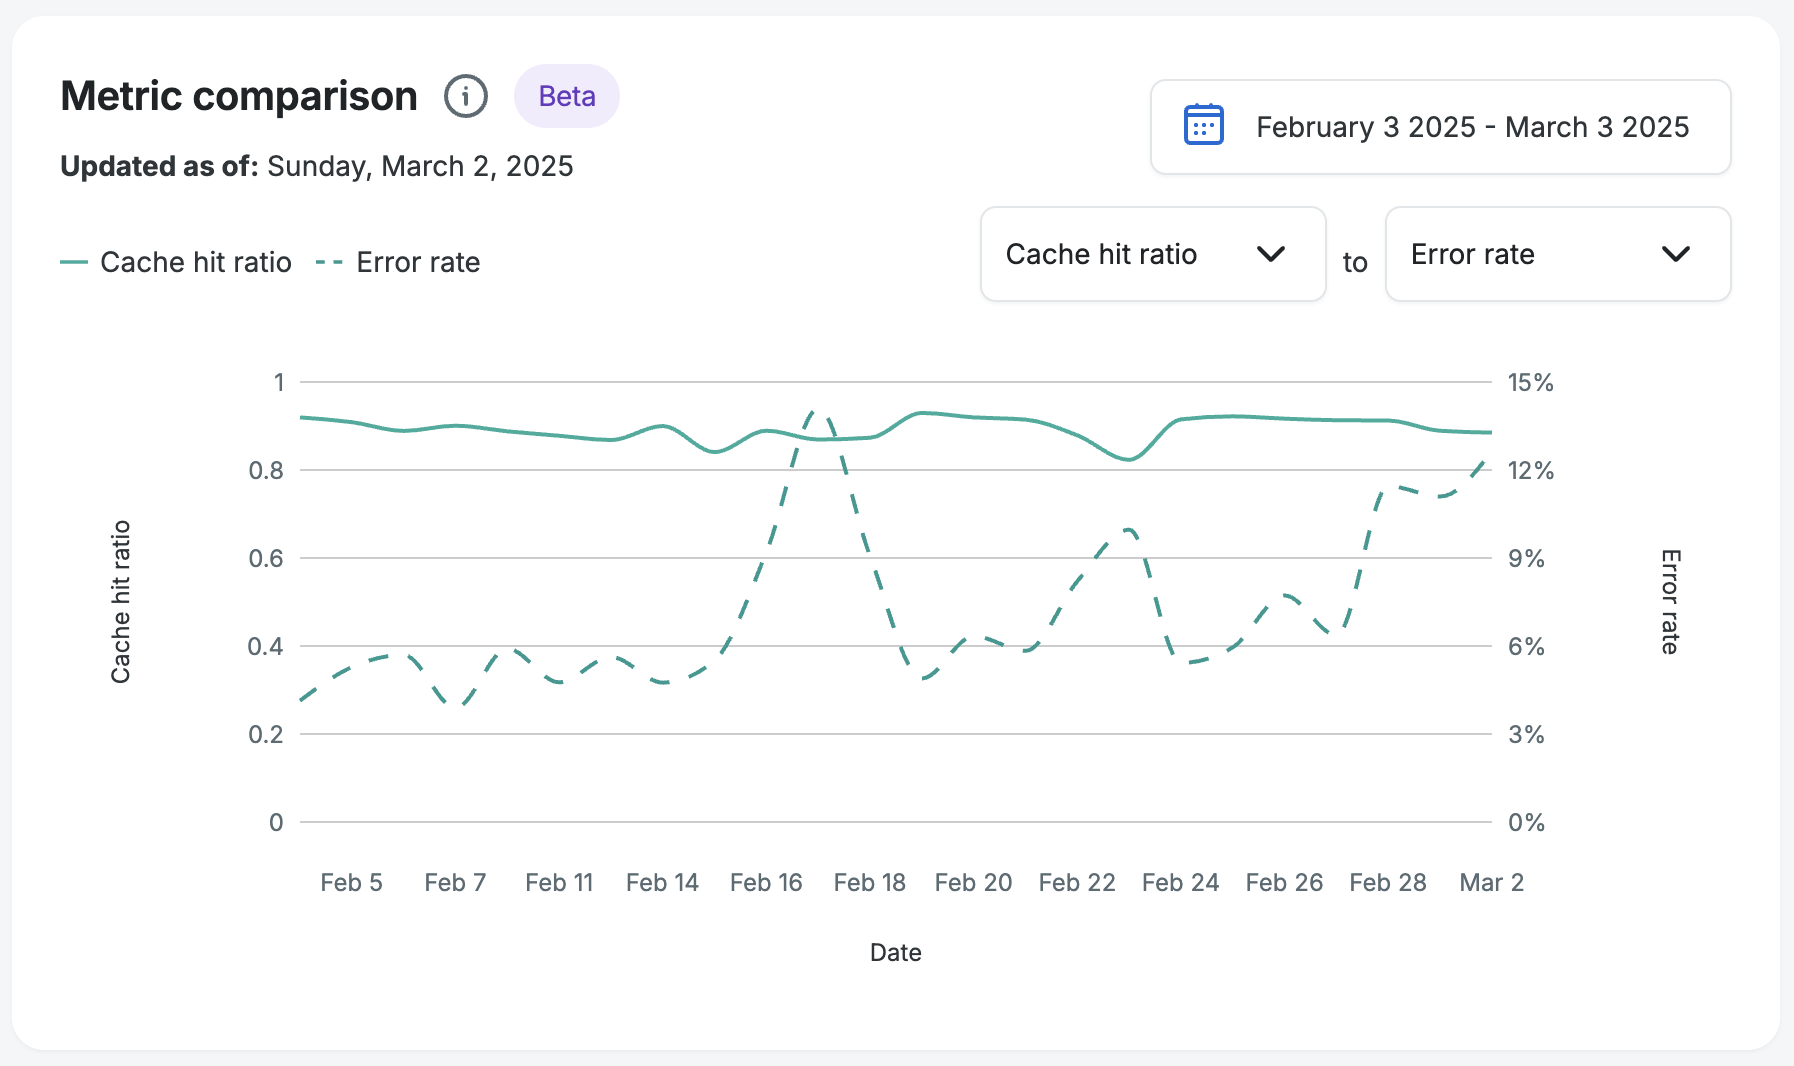
Slow Pages
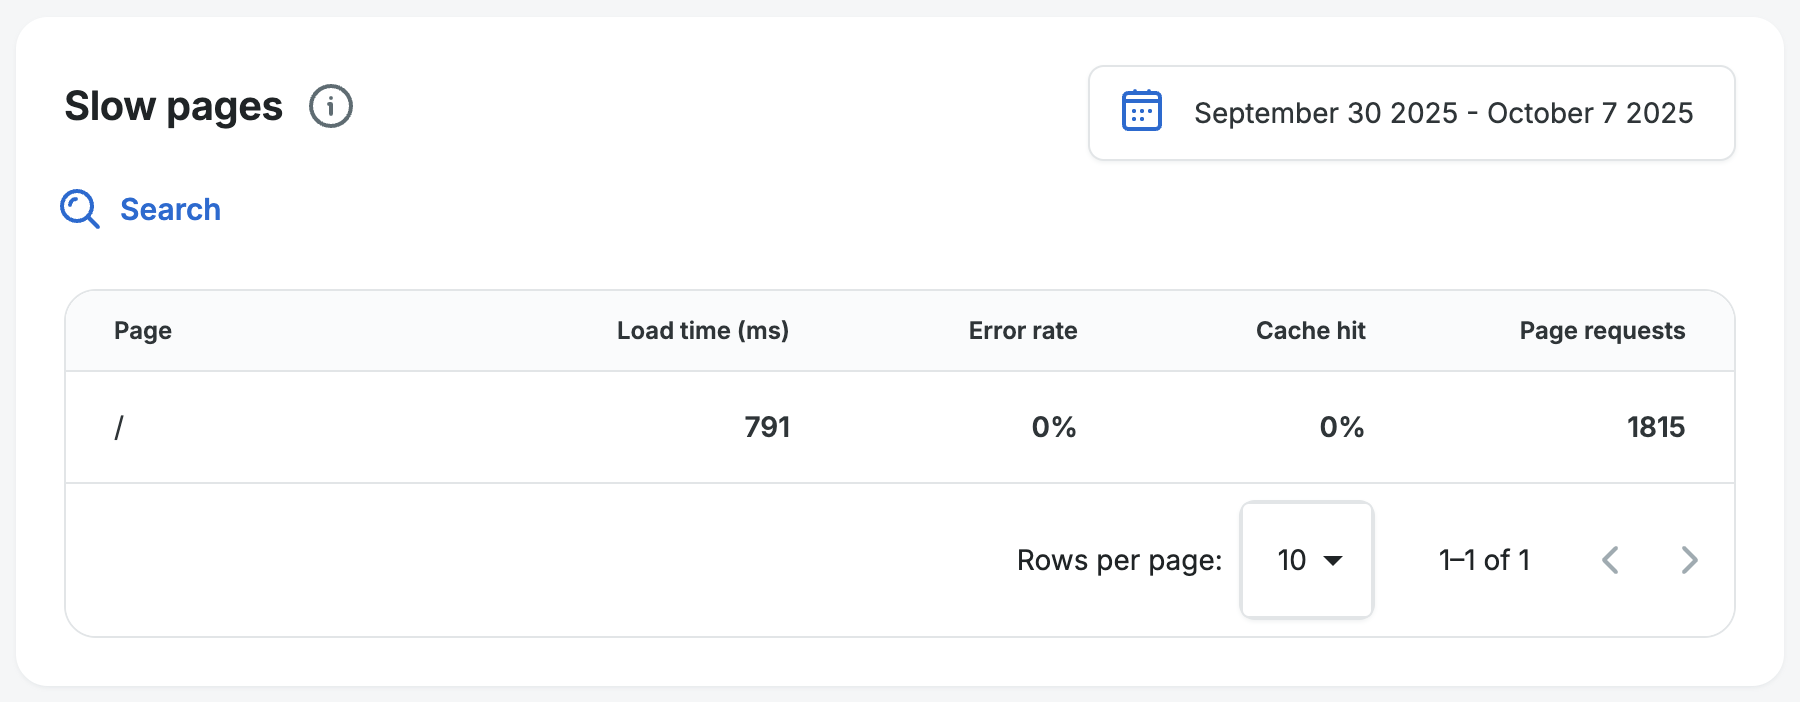
These are the pages with the highest latency among those receiving page requests on your site. Use this list to identify the pages to optimize for the biggest impact.
Up to 20 slow pages will be displayed for any given time period. You can choose to view the list of slow pages for a given day or over a period of up to 7 days to identify if the slowest pages receiving traffic on your site change over time. For the greatest impact to your performance score, begin by investigating pages with a combination of high average load times and high page request counts.
Note
This table will show the slowest pages recently viewed for your website, even if all of your pages are fast like the example below where the average load time is 0.79 seconds (791ms).
Slow Query Monitor
This graph allows you to see the impact of slow database queries running on your site. This gives you a broader view of the occurrence of slow queries going back up to 30 days.
Note
Currently the slow query monitor graph is only available to accounts on eCommerce plans and Agency plans, or to sites with our new eCommerce Performance Pack.
The graph shows total duration and total count of slow queries by day. You can use the toggle button above the graph to switch between the two metrics. Ideally both numbers would be 0 for each day meaning that all of your database queries complete in under 5 seconds and no slow queries are present.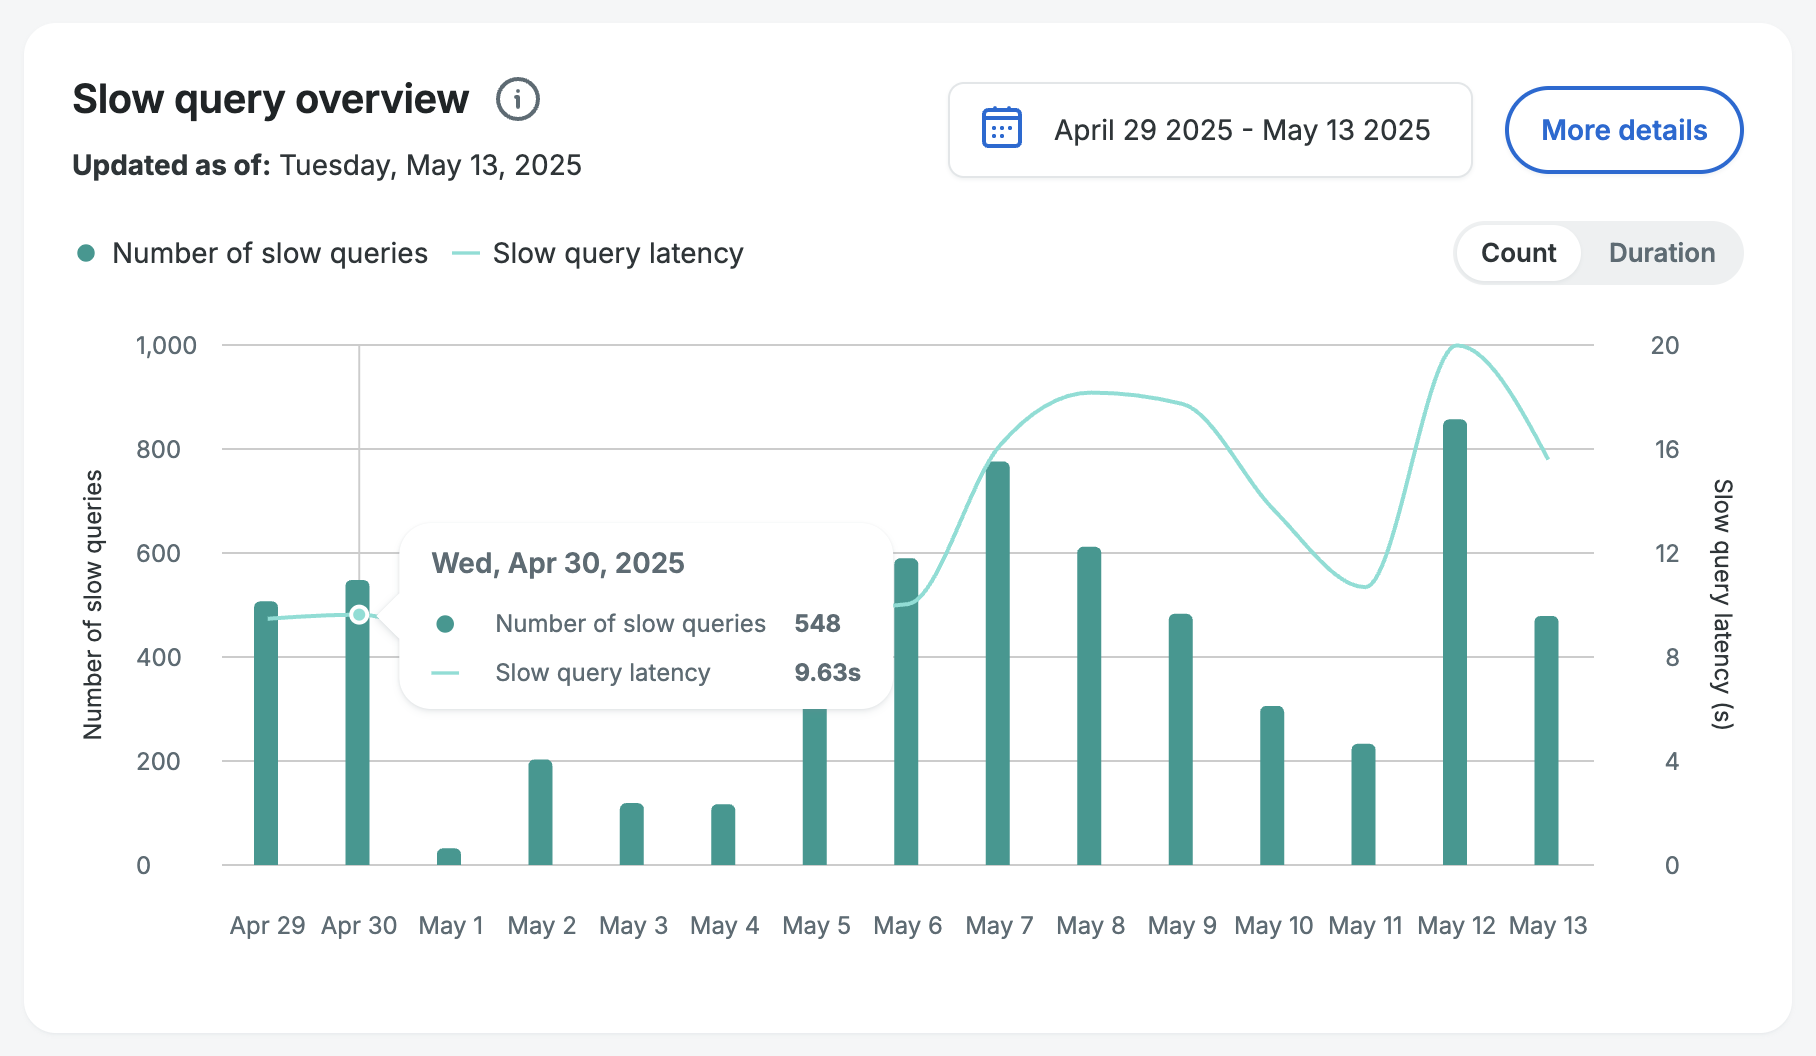
The graph also shows the slow query latency (average duration) of slow queries for a day. You can see it represented by the line on the graph and also when you hover on the bar for a specific day.
Note
The latency metric here will not align directly with the average page latency seen above, as this chart shows the latency impact of slow queries only.
If the graph indicates a substantial issue with slow queries, then you can click the More details button in the top right of the graph to see the full detailed view and narrow down the source of the slow queries affecting your page performance.
Learn more about how to leverage the slow query monitor to speed up your site and improve conversions.
Set Notifications
To choose your notification method you can navigate to the Notification Settings page. In addition to using the link you can also navigate there by using the Notification settings button on the Insights > Performance page for an environment. The link will be in the WP Engine site performance score section. You can also click the Bell icon in the top right of the Portal, and then click the Gear icon. You can see both options in the image below.
Then choose any of the 3 types of notifications outlined below, Portal, Slack, and Email.
Add Portal Notifications
- Click the dropdown arrow to the right of the Portal option.
- Scroll down to the Performance Insights section and click the arrow to open it if it’s not already expanded.
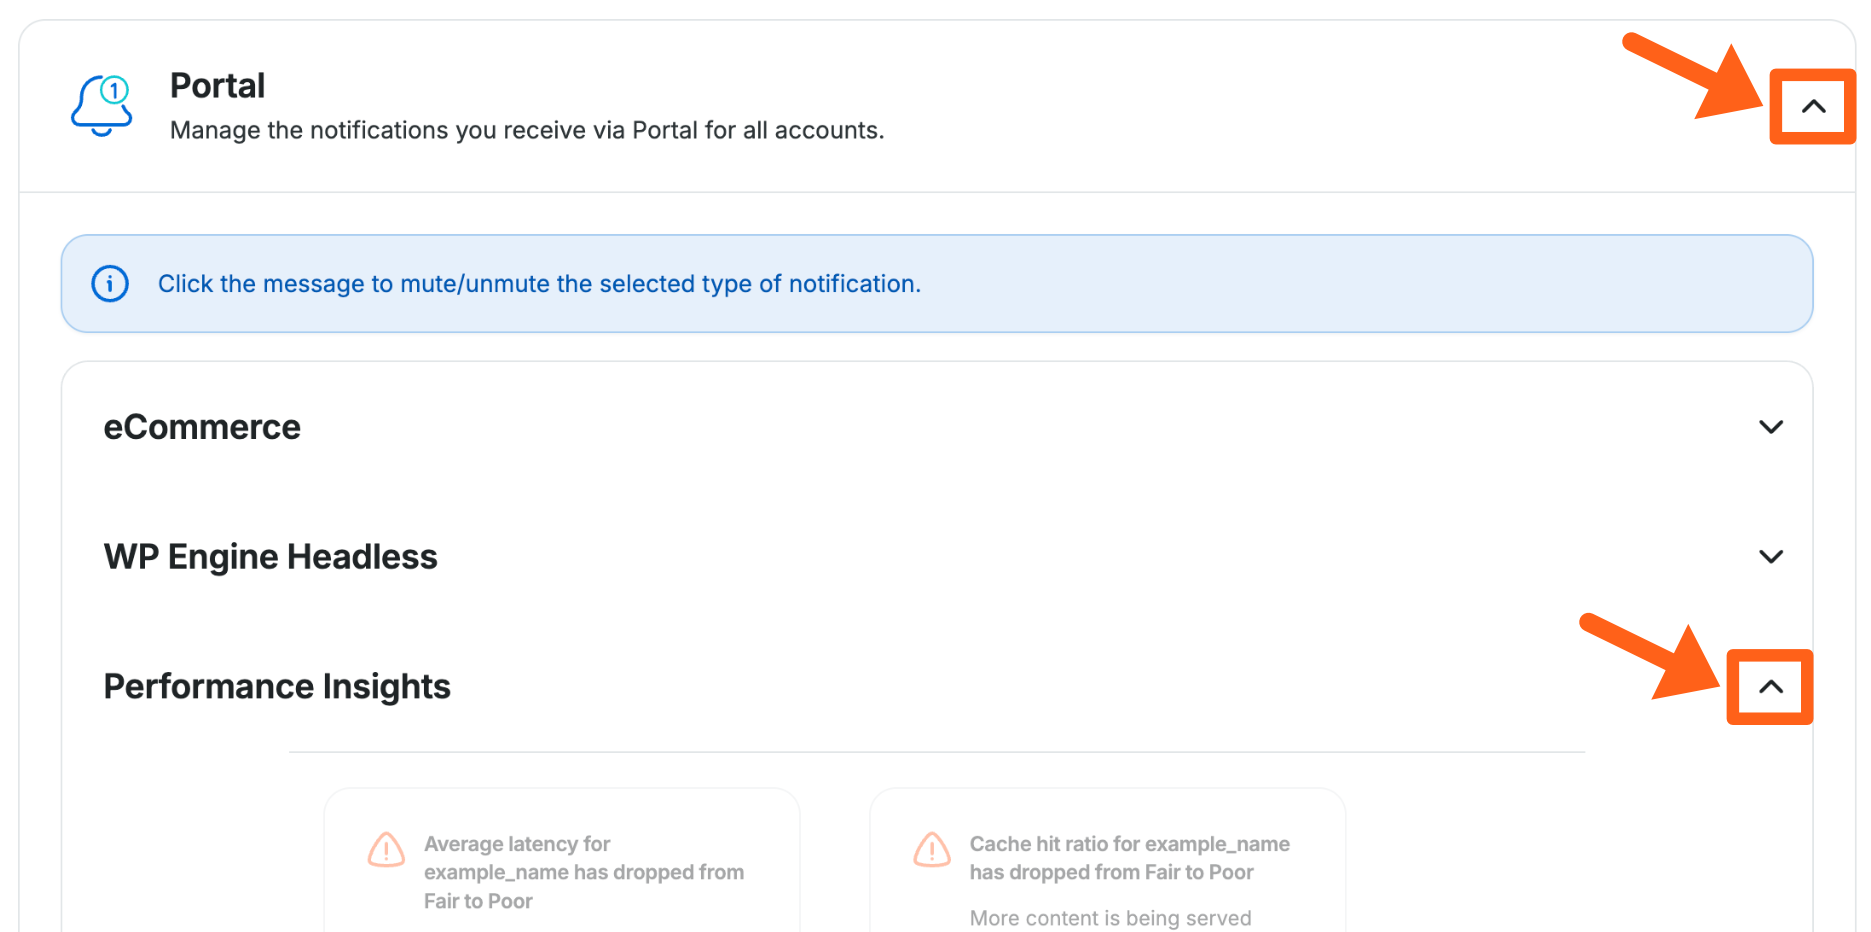
- Click any of the 4 warning type notifications for the main performance metrics to enable them.
- Notification choices will be grayed out when they are not turned on. Clicking the box will enable it.
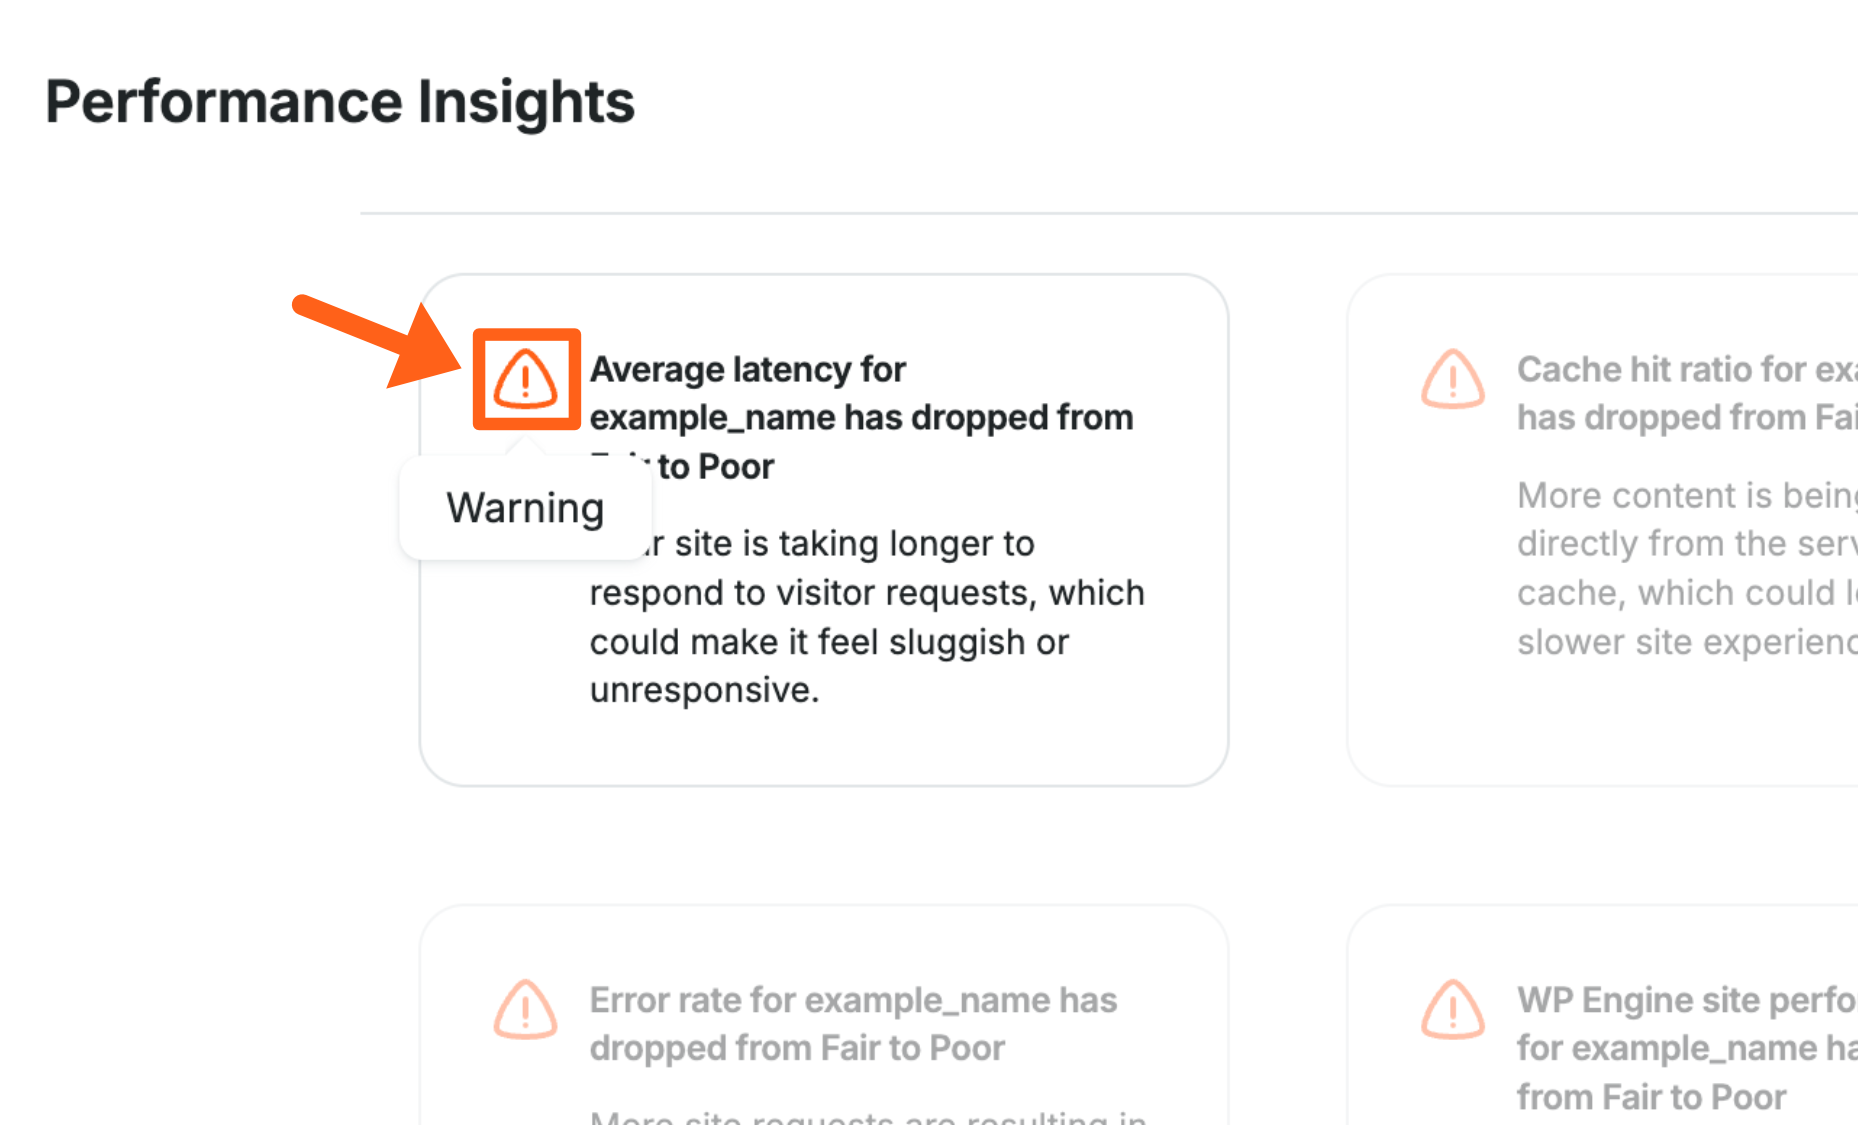
- Notification choices will be grayed out when they are not turned on. Clicking the box will enable it.
Add Slack Notifications
- Click the dropdown arrow to the right of the Slack option
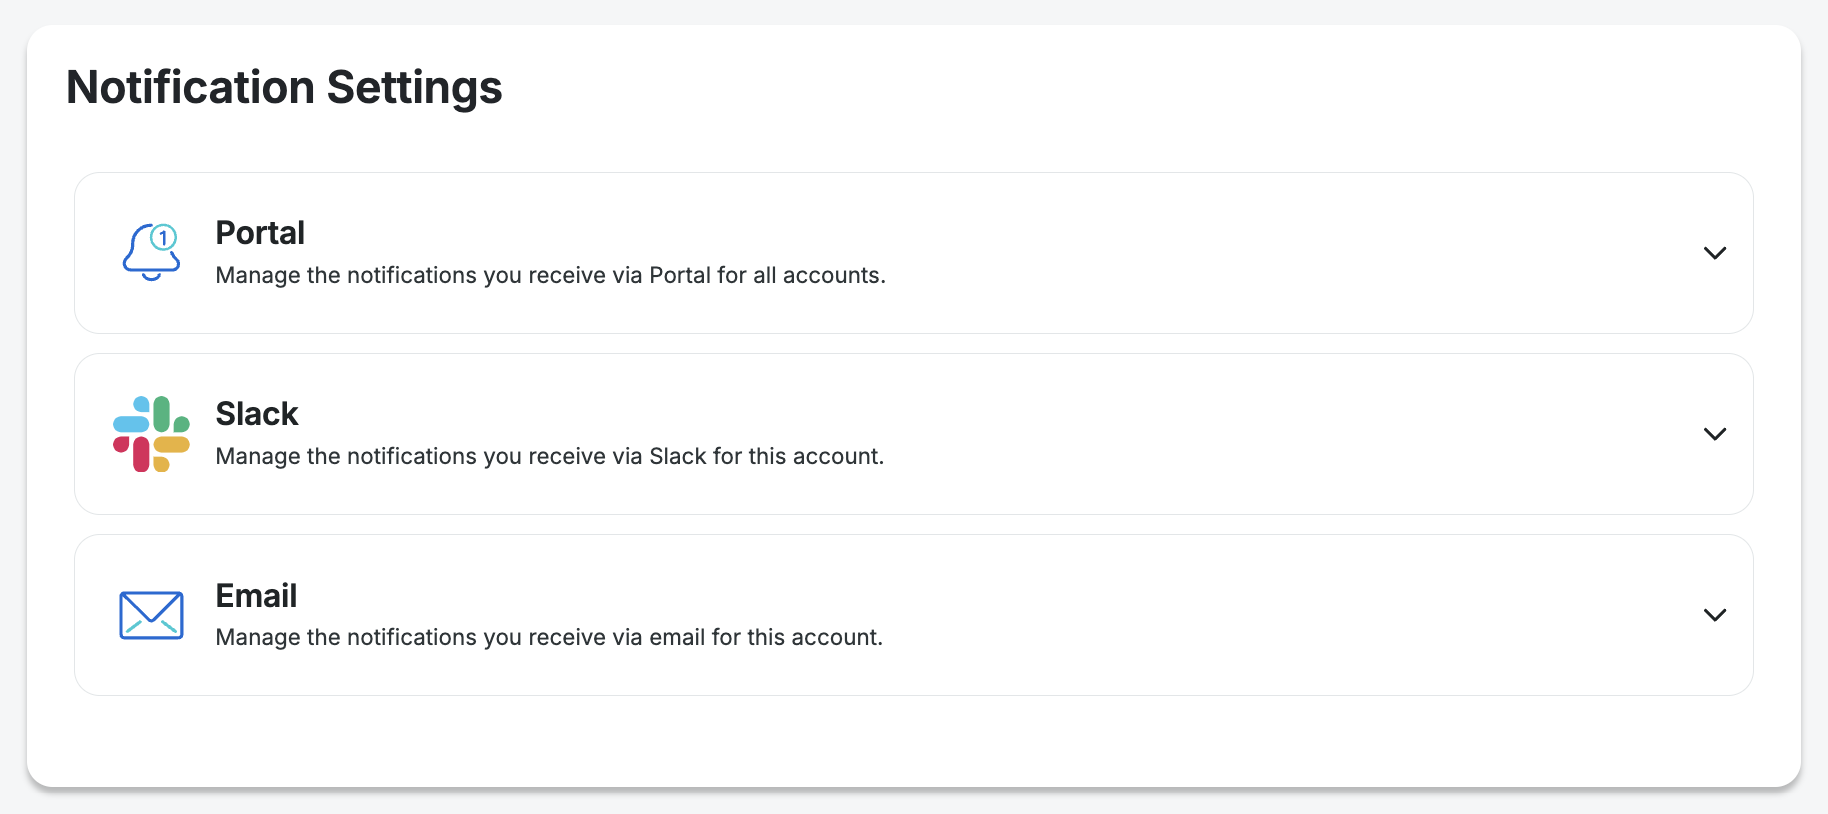
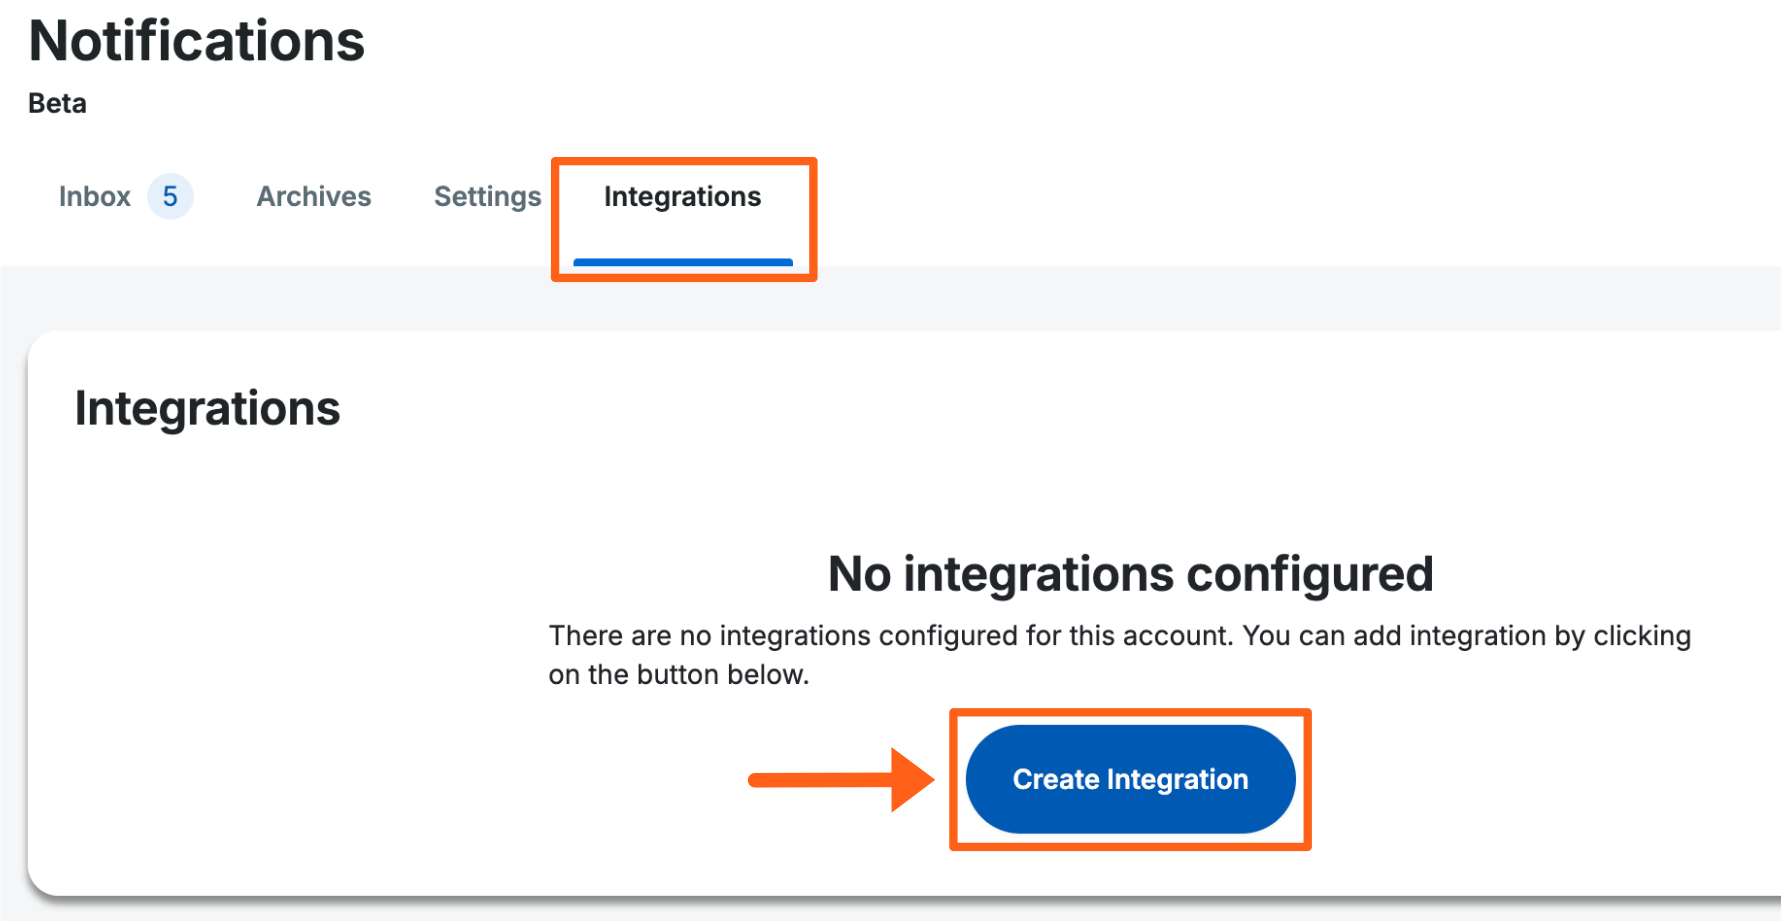
- If you have not yet connected Slack, click the Add to Slack button and you’ll be taken from the Settings tab to the Integrations tab. If you have connected Slack already then you can skip to step 7 to Create Policy.

- Click Create Integration
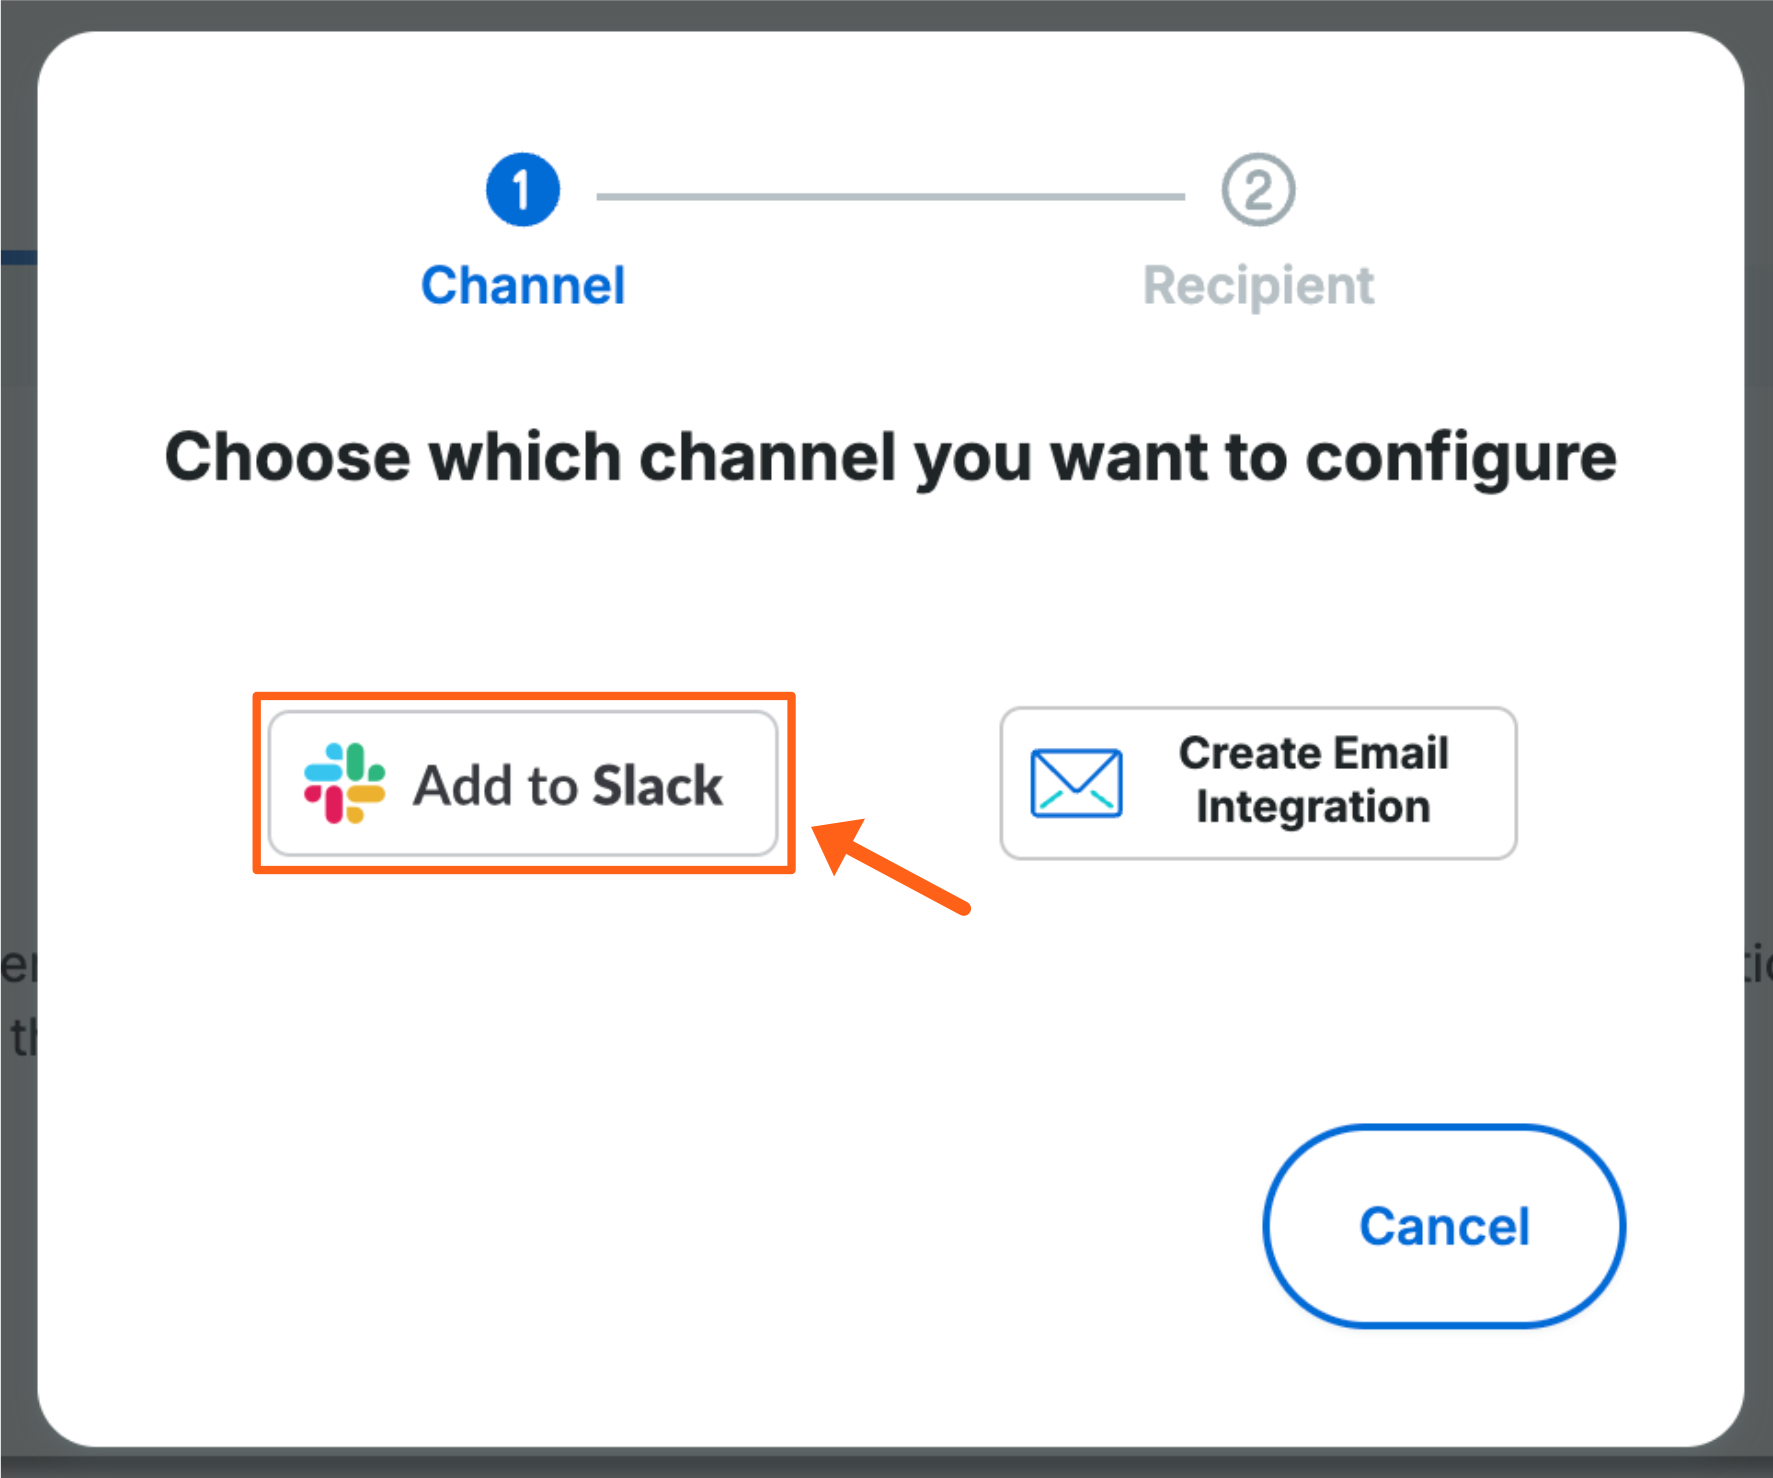
- Click the Add to Slack button again in the popup window
- Then in the next window, approve the permissions to connect to Slack
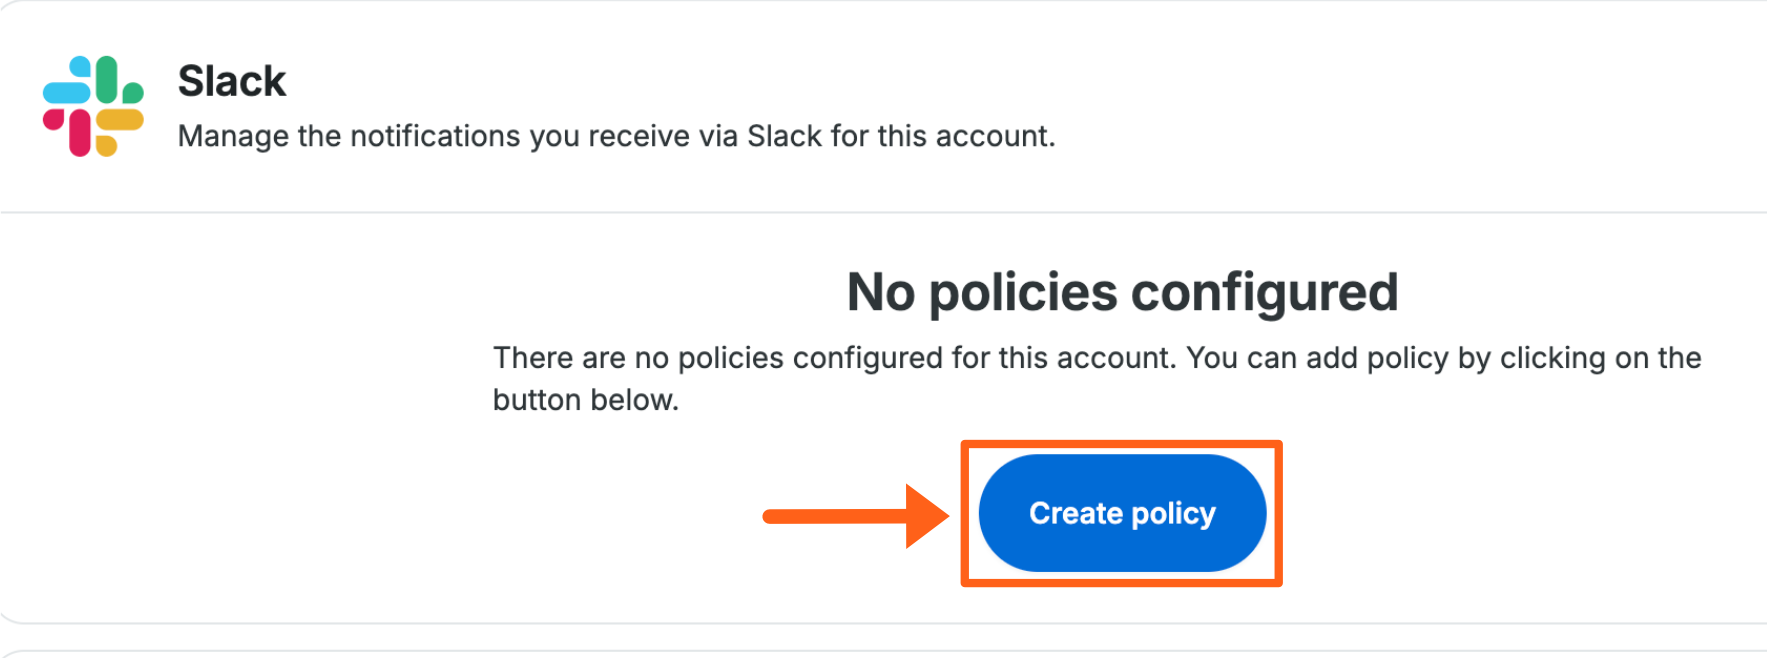
- Then return to the Settings tab and click the dropdown arrow to the right of the Slack option again

- Click Create policy
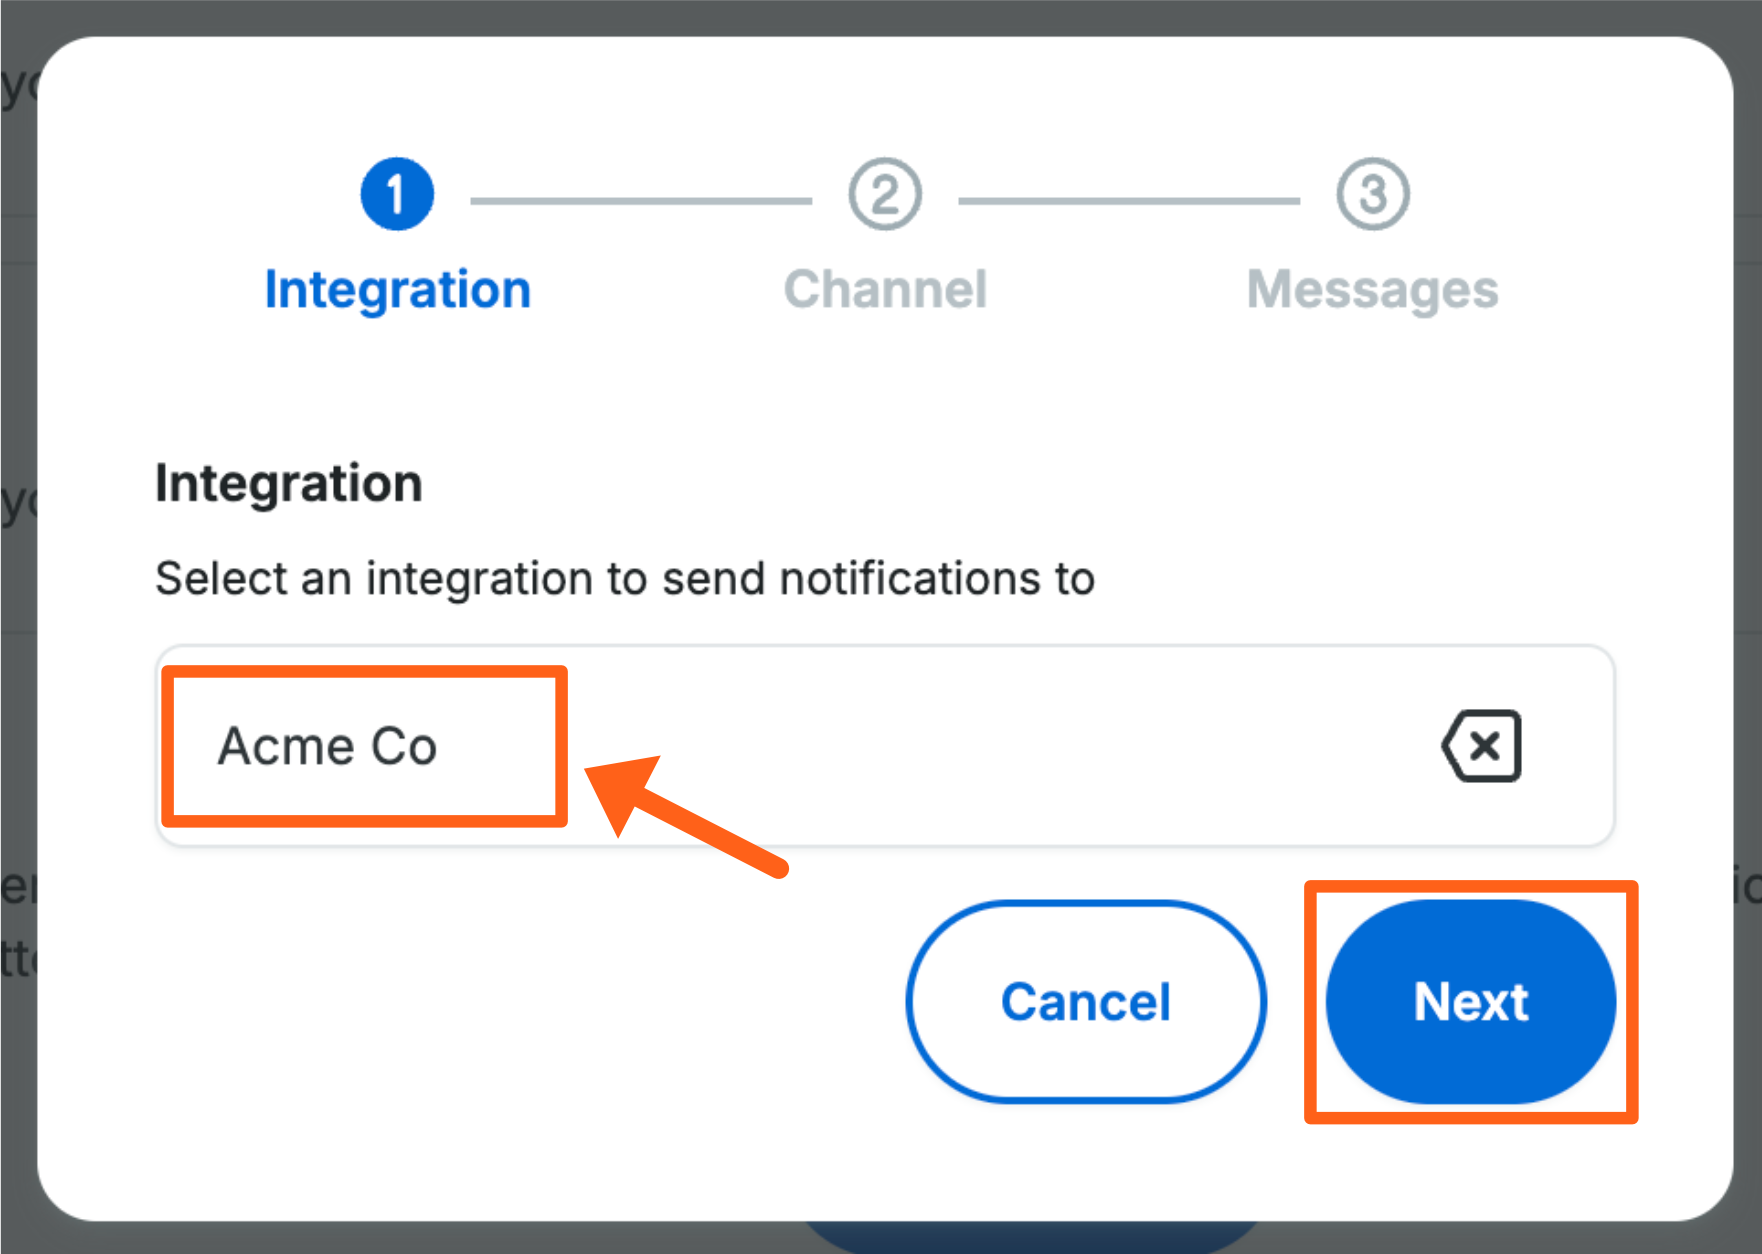
- Choose the Slack group that you want to send notifications to and then click Next
- Choose a public Slack channel to send notifications to and click Next
- Scroll down to the Performance Insights section and click the arrow to open it if it’s not already expanded.
- Click any of the 4 warning type notifications for the main performance metrics to enable them.
- Notification choices will be grayed out when they are not turned on. Clicking the box will enable it.

- Notification choices will be grayed out when they are not turned on. Clicking the box will enable it.
- Scroll to the bottom of the popup window and click Create Policy in the bottom right.
Add Email Notifications
- Click the dropdown arrow to the right of the Email option

- Click the Create policy button

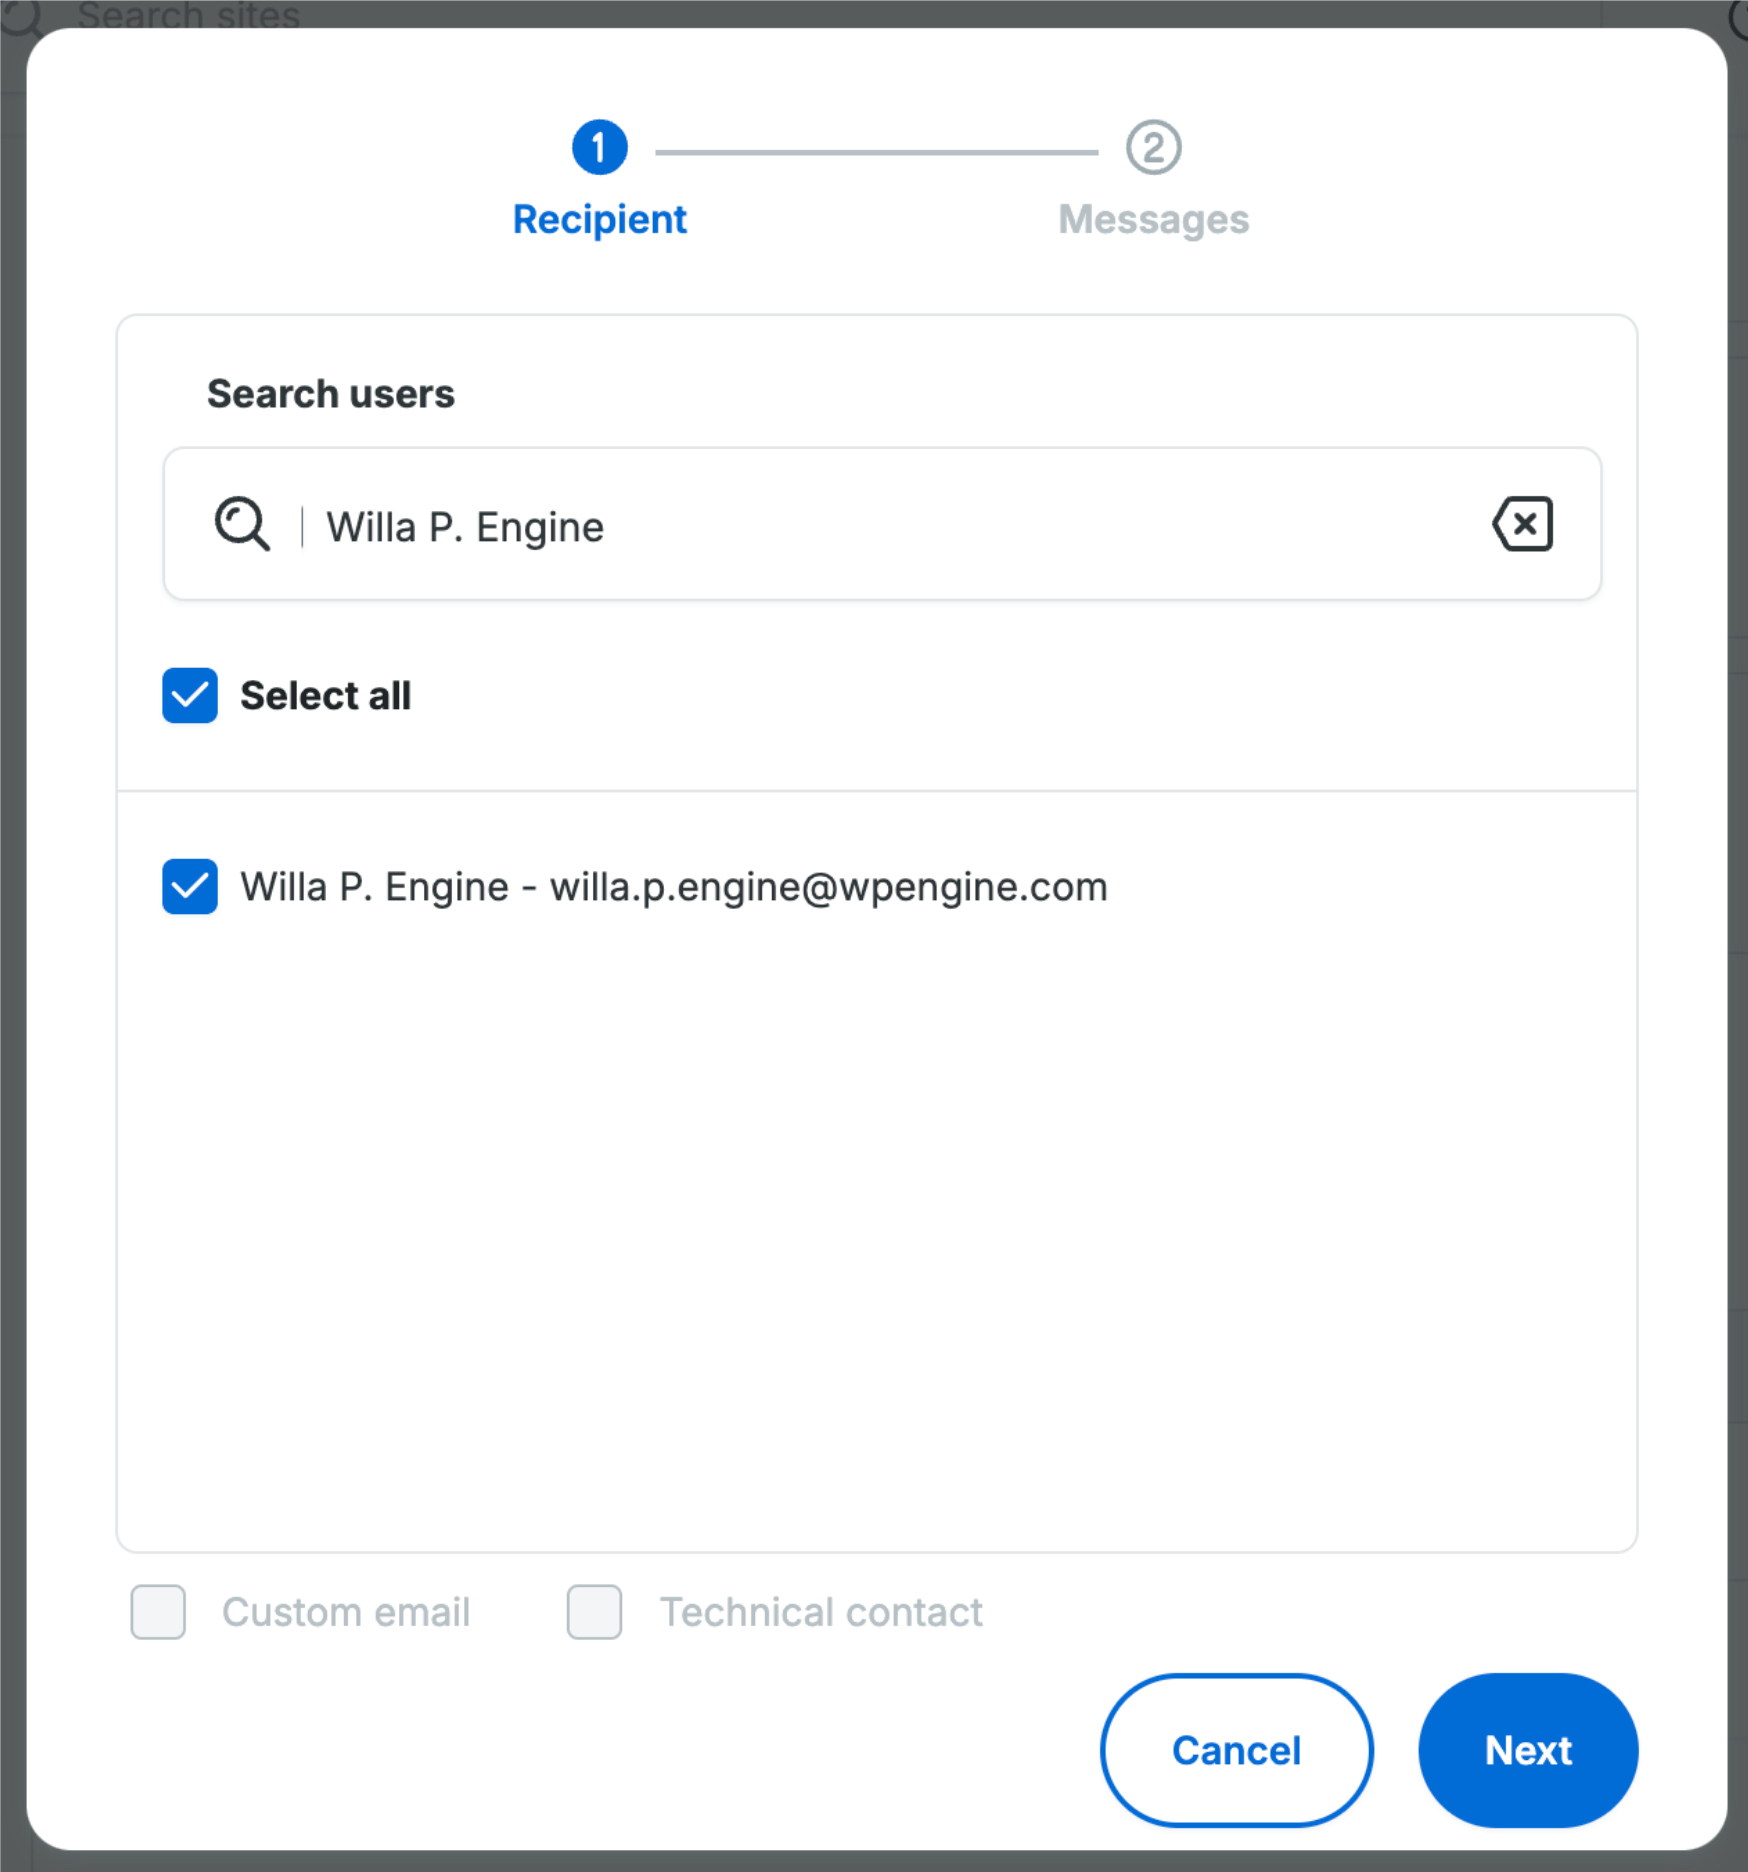
- Search for users and check the box next to each that you want to receive email notifications
- Scroll down to the Performance Insights section and click the arrow to open it if it’s not already expanded.
- Click any of the 4 warning type notifications for the main performance metrics to enable them.
- Notification choices will be grayed out when they are not turned on. Clicking the box will select it.

- Notification choices will be grayed out when they are not turned on. Clicking the box will select it.
- Scroll to the bottom of the popup window and click Create Policy in the bottom right.
Next steps: Learn about account-level performance insights
