Get Started
Site Monitoring
Tags:
Key Takeaways
WP Engine’s Site Monitoring product sends pings to detect outages every 5 minutes, providing quick alerts for errors like 404 or 500.
Swift response to outages involves checking system status, access logs, and error logs to troubleshoot efficiently.
Site Monitoring’s Status column displays uptime status, failed checks, and response time for each environment.
Adding Site Monitors allows monitoring of Production environments and additional URLs for comprehensive coverage.
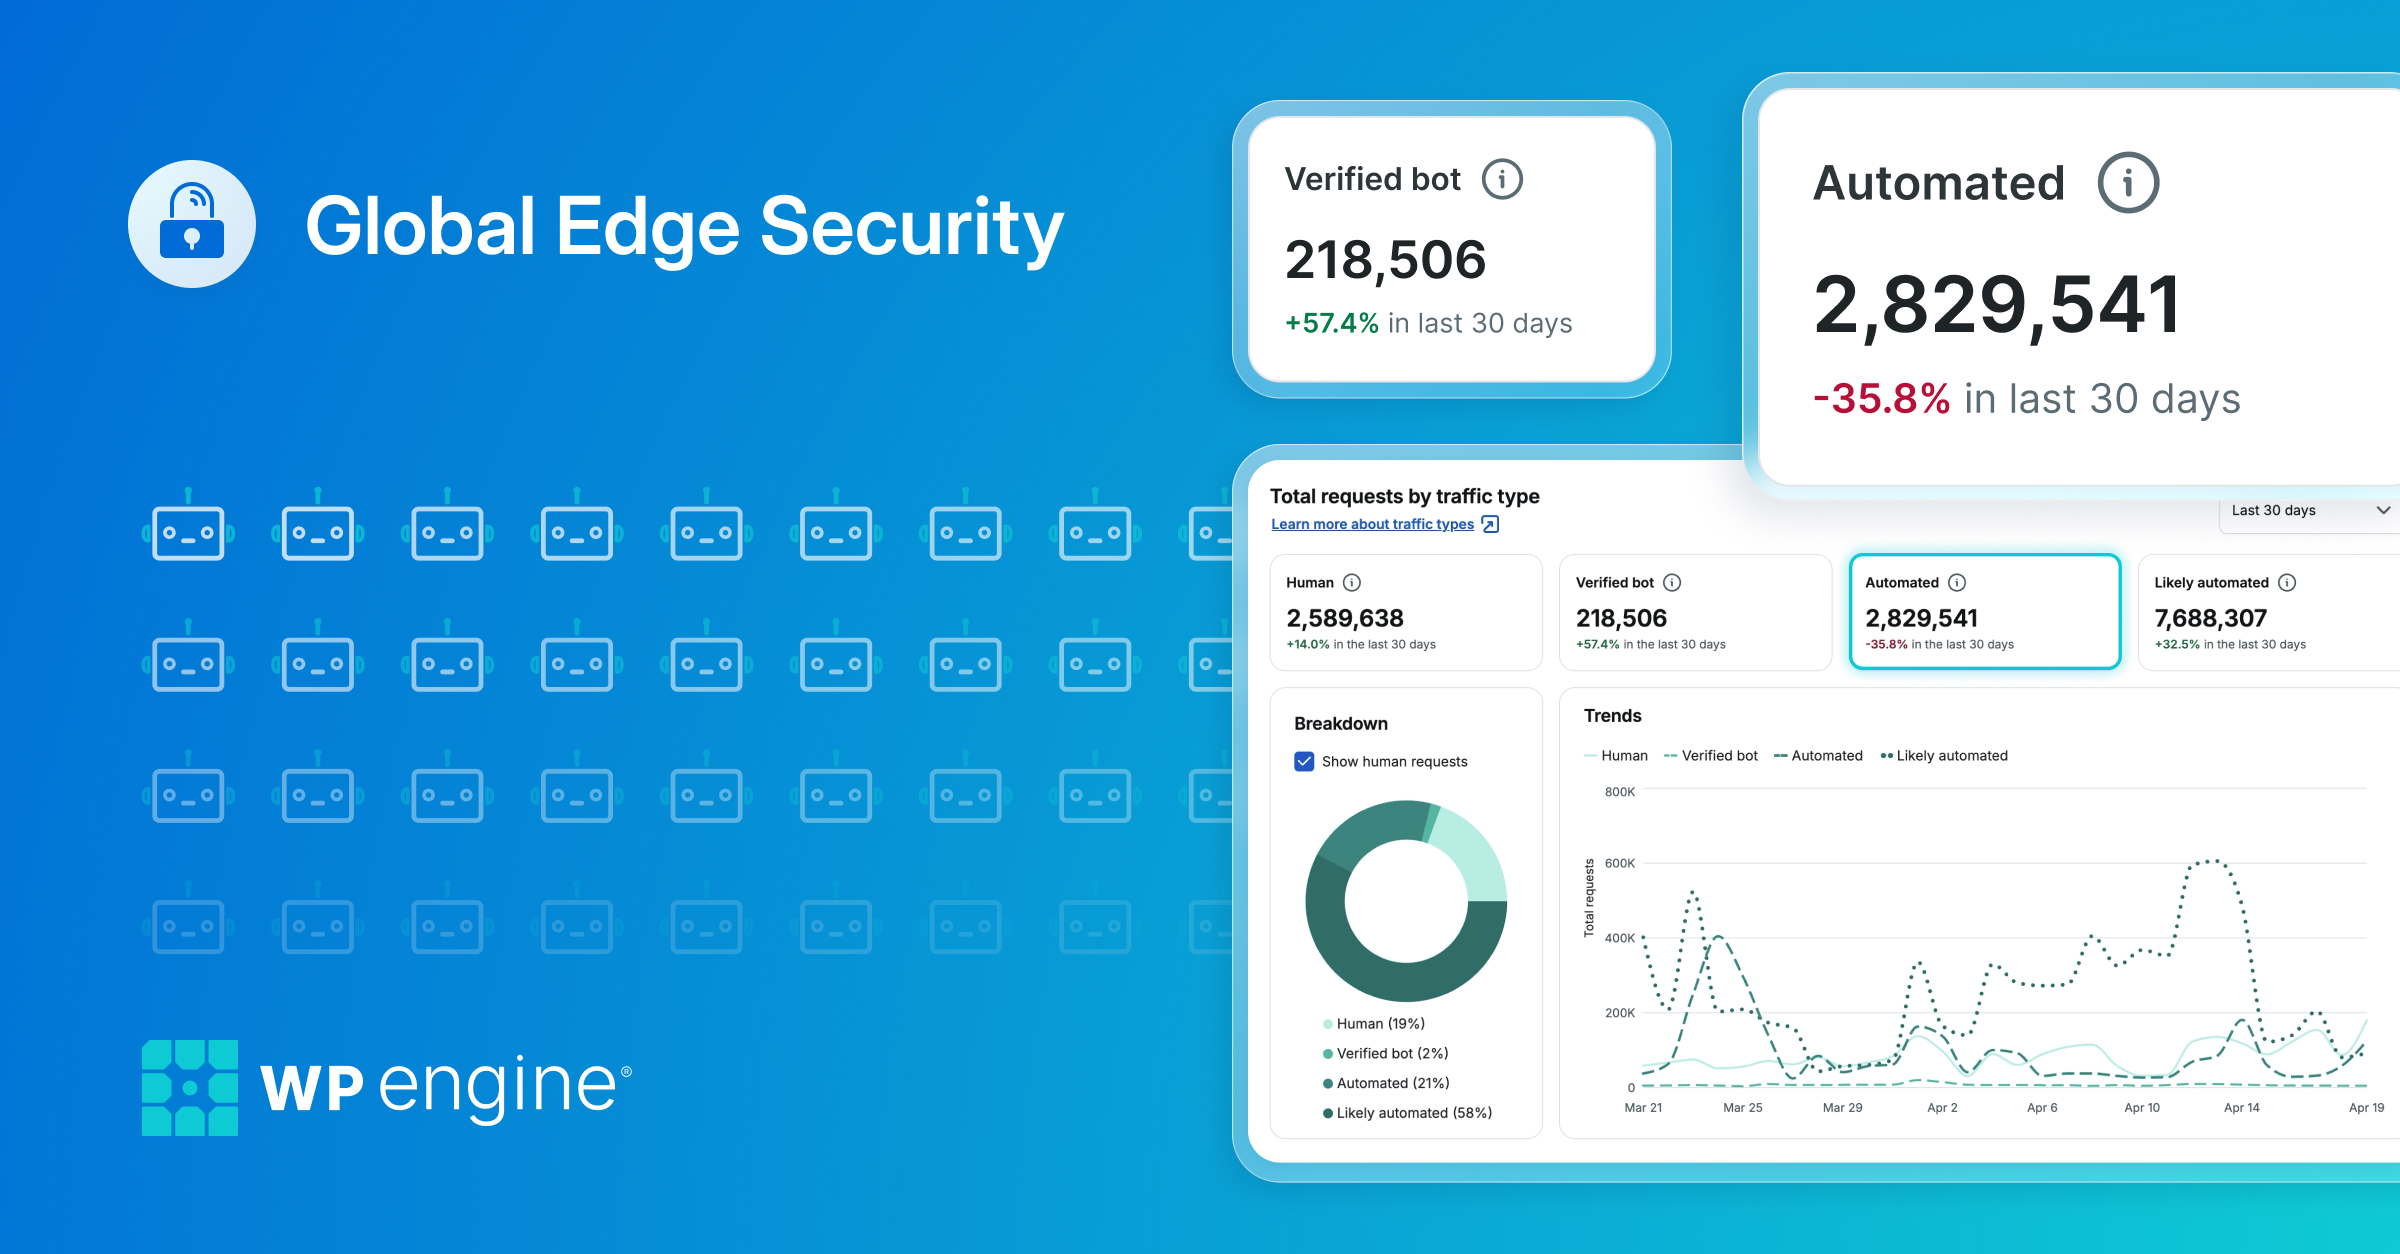
WP Engine monitors your server for uptime and outages, however if you’re looking to monitor an individual website for errors the Site Monitoring product extension is available. Site Monitoring is a paid product extension designed to help you detect and respond quickly to an outage on your website.
With the Site Monitoring product, WP Engine will monitor selected sites on your account to confirm that your environments are accessible to users. Additionally, notification alerts can also be configured to ensure you’re always in the loop, should any issue arise.
Looking for temporary monitoring instead? Premium accounts can request event monitoring by speaking with WP Engine Support.
The Site Monitoring product extension can be purchased for WP Engine hosting plans from the Modify Plan page.
About Outages
WP Engine’s Site Monitoring product will send a ping to the primary domain of the Production environment(s) where Site Monitoring is enabled. If an outage is detected, you will see an alert banner at the top of the Site Monitoring page indicating such. You will also receive an alert with the environment name and the error code, if you have alerts configured.
Site Monitoring detects outages on the homepage (such as a 404 or 500 error) but does not provide information regarding server-level outages. Therefore, we recommend signing up for platform status updates at wpenginestatus.com as well.
Detecting an Outage
To detect an outage, the site is pinged every five minutes. After two consecutive failures (for a total of 10 minutes), an outage is detected and reported.
Site Monitoring pings only the Primary domain of the the Production environment, by default. For example, https://domain.com/ is monitored, but an image used on that homepage https://domain.com/wp-content/images/image.png is not monitored. Monitoring for additional URLs can be set up if needed.
Some of the most common domain response codes the Site Monitoring product will look for are:
- 401 – Unauthorized (This error will display if your site is locked by password protection.)
- 403 – Forbidden error
- 404 – Page not found
- 500 – Internal Server Error (“Whitescreen of Death”)
- 502 – Bad Gateway
- 503 – Service Unavailable
- 504 – Gateway Timeout
All 2xx/3xx status codes, which indicate success or redirection (EX: 200 or 301), are used to determine if the site is accessible and that there is no outage.
Responding to an Outage
Being notified when an outage is occurring is the first step to a quick resolution. Once you’re aware of the environment that’s experiencing an outage you’ll need to proceed swiftly to collect information and triage the error.
The best thing to do when your site is down is to determine if the downtime is caused by an internal factor (a modification you, or your team, have recently made to the site, for example) or an external one (WP Engine is experiencing degraded performance or scheduled maintenance, for example) and then go from there.
- First, check WP Engine’s System Status page. This is where you can keep on top of any disruptions in service to our WP platform, support services, or product features.
- Alternatively, if you configure Site Monitoring alerts, the outage alert will tell you our current platform status.
- If there are no outages on WP Engine’s System Status page, you should next check the specific environment’s Access Logs.
- Use the filters in the Access Logs to find the response code you are troubleshooting: 400, 404, 500, 502, 504, etc.
- If you do not see any errors in the Access Logs, you should check the environment’s Error Logs for any recent entries.
Once you have found the error in the logs, you can troubleshoot in a few ways:
- Cross-reference the response codes with our Common WordPress® Error guide.1 https://wpengine.com/support/error/
- Cross-reference the error code with our PHP Error guide. https://wpengine.com/support/troubleshoot-wordpress-wp-engine-error-log/
- Review our Troubleshooting WordPress guide to help diagnose and triage the issue. https://wpengine.com/support/troubleshoot-wordpress/
- Check for any recent changes to the site. Changes can be reverted easily if needed by using our automated backup and restore functionality. https://wpengine.com/support/restore/
- Contact Support. Our Support team can help look into any issues you may be experiencing. While we cannot support questions related to specific code, our team is composed of experienced troubleshooters who are happy to help interpret logs and pinpoint issues. You can reach out to Support 24×7, 365 days a year!
Access Site Monitoring
Managing the Site Monitoring product can be managed from your WP Engine User Portal.
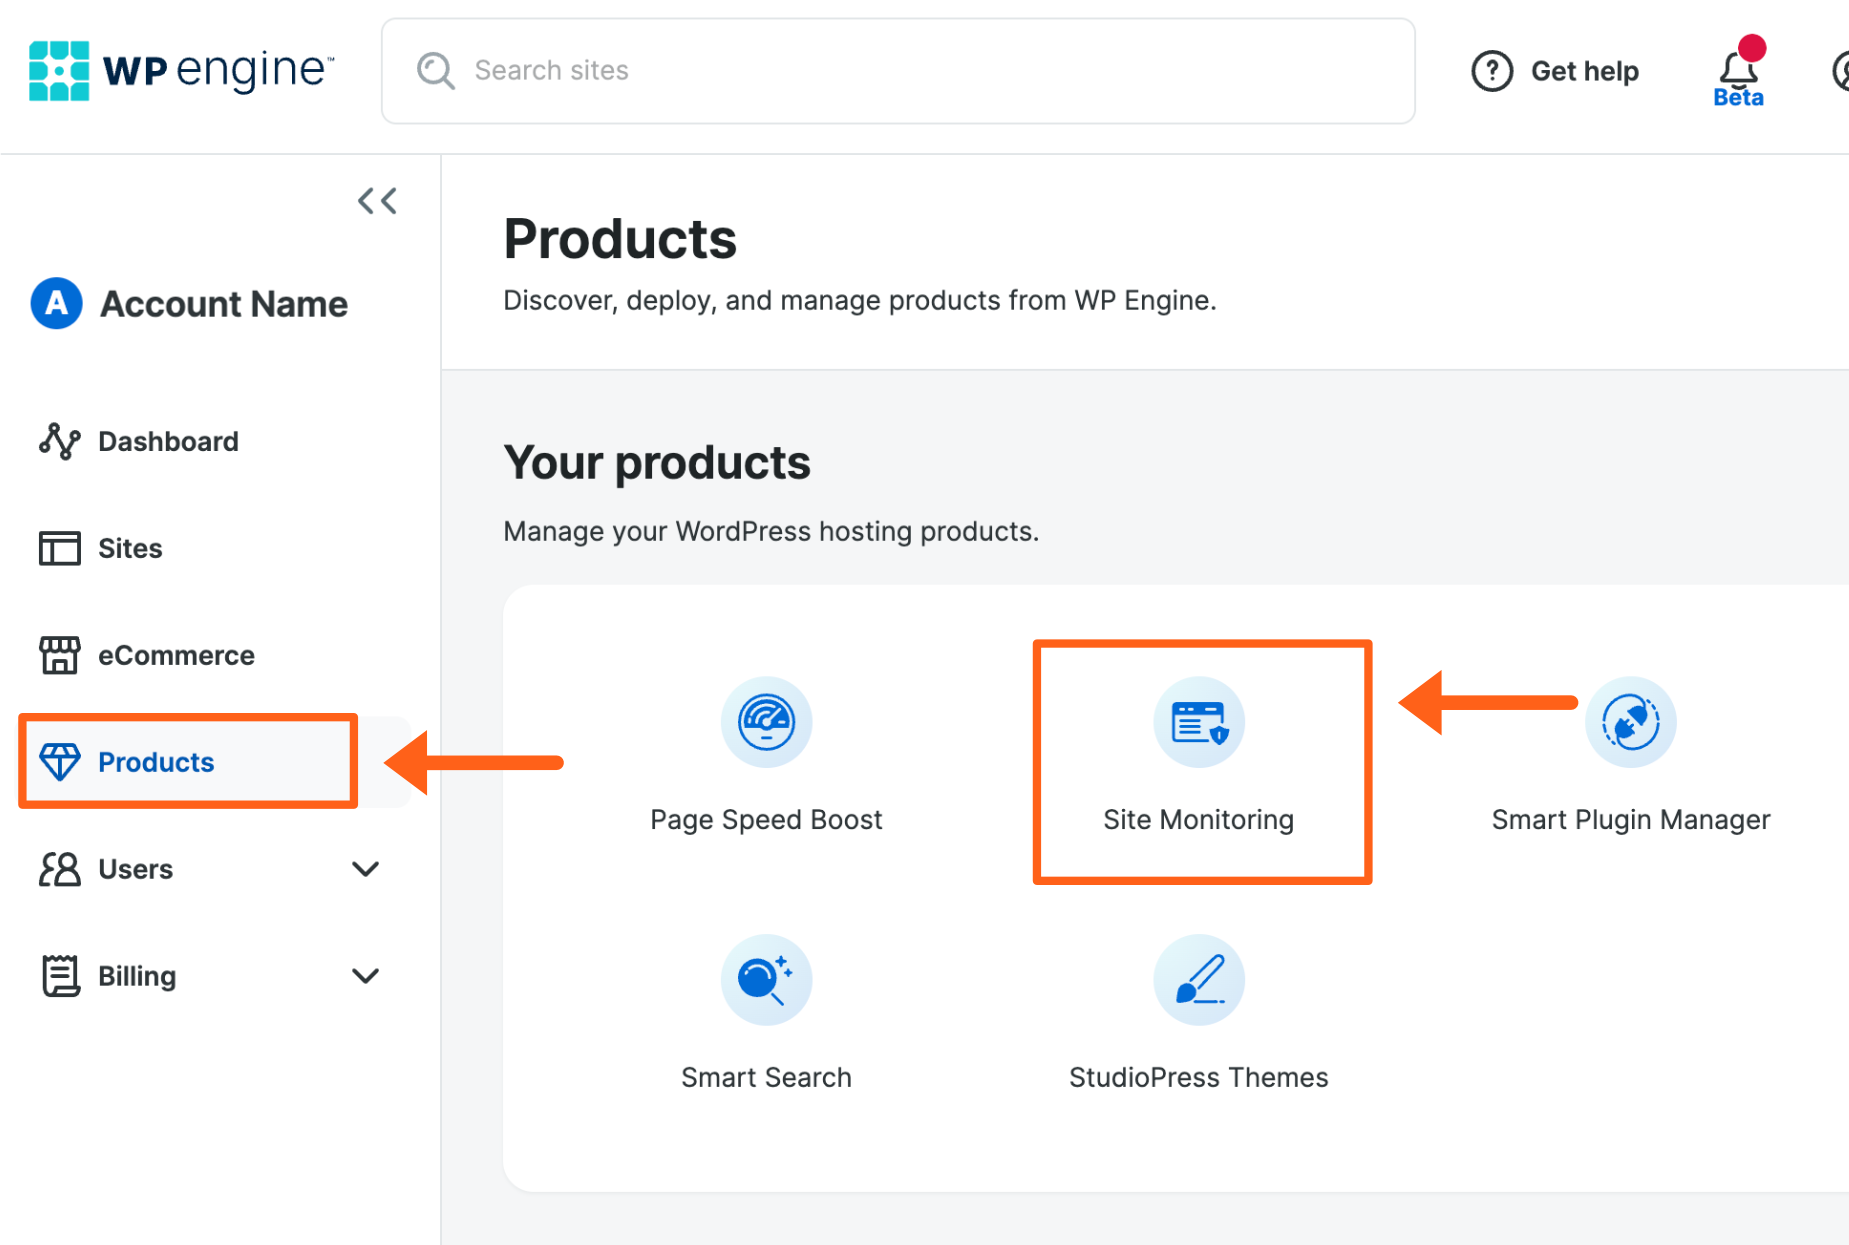
- From the WP Engine User Portal
- Click on Products in the main sidebar menu
- Click on Site Monitoring under Your products
- Found directly at: https://my.wpengine.com/products/site_monitors
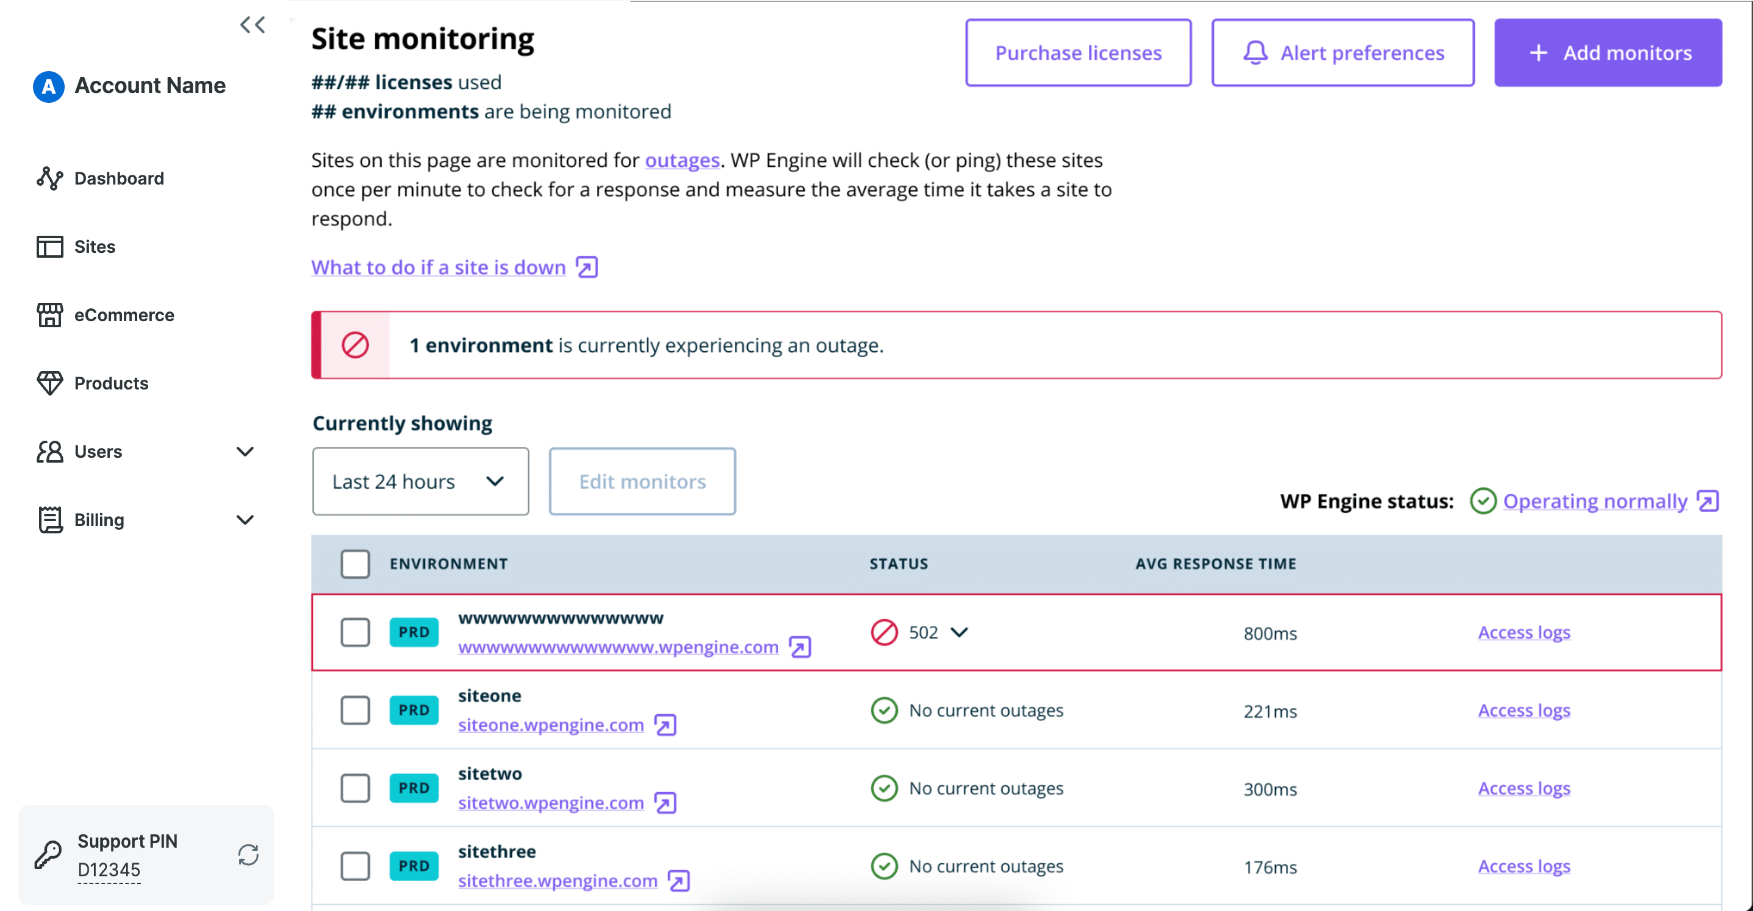
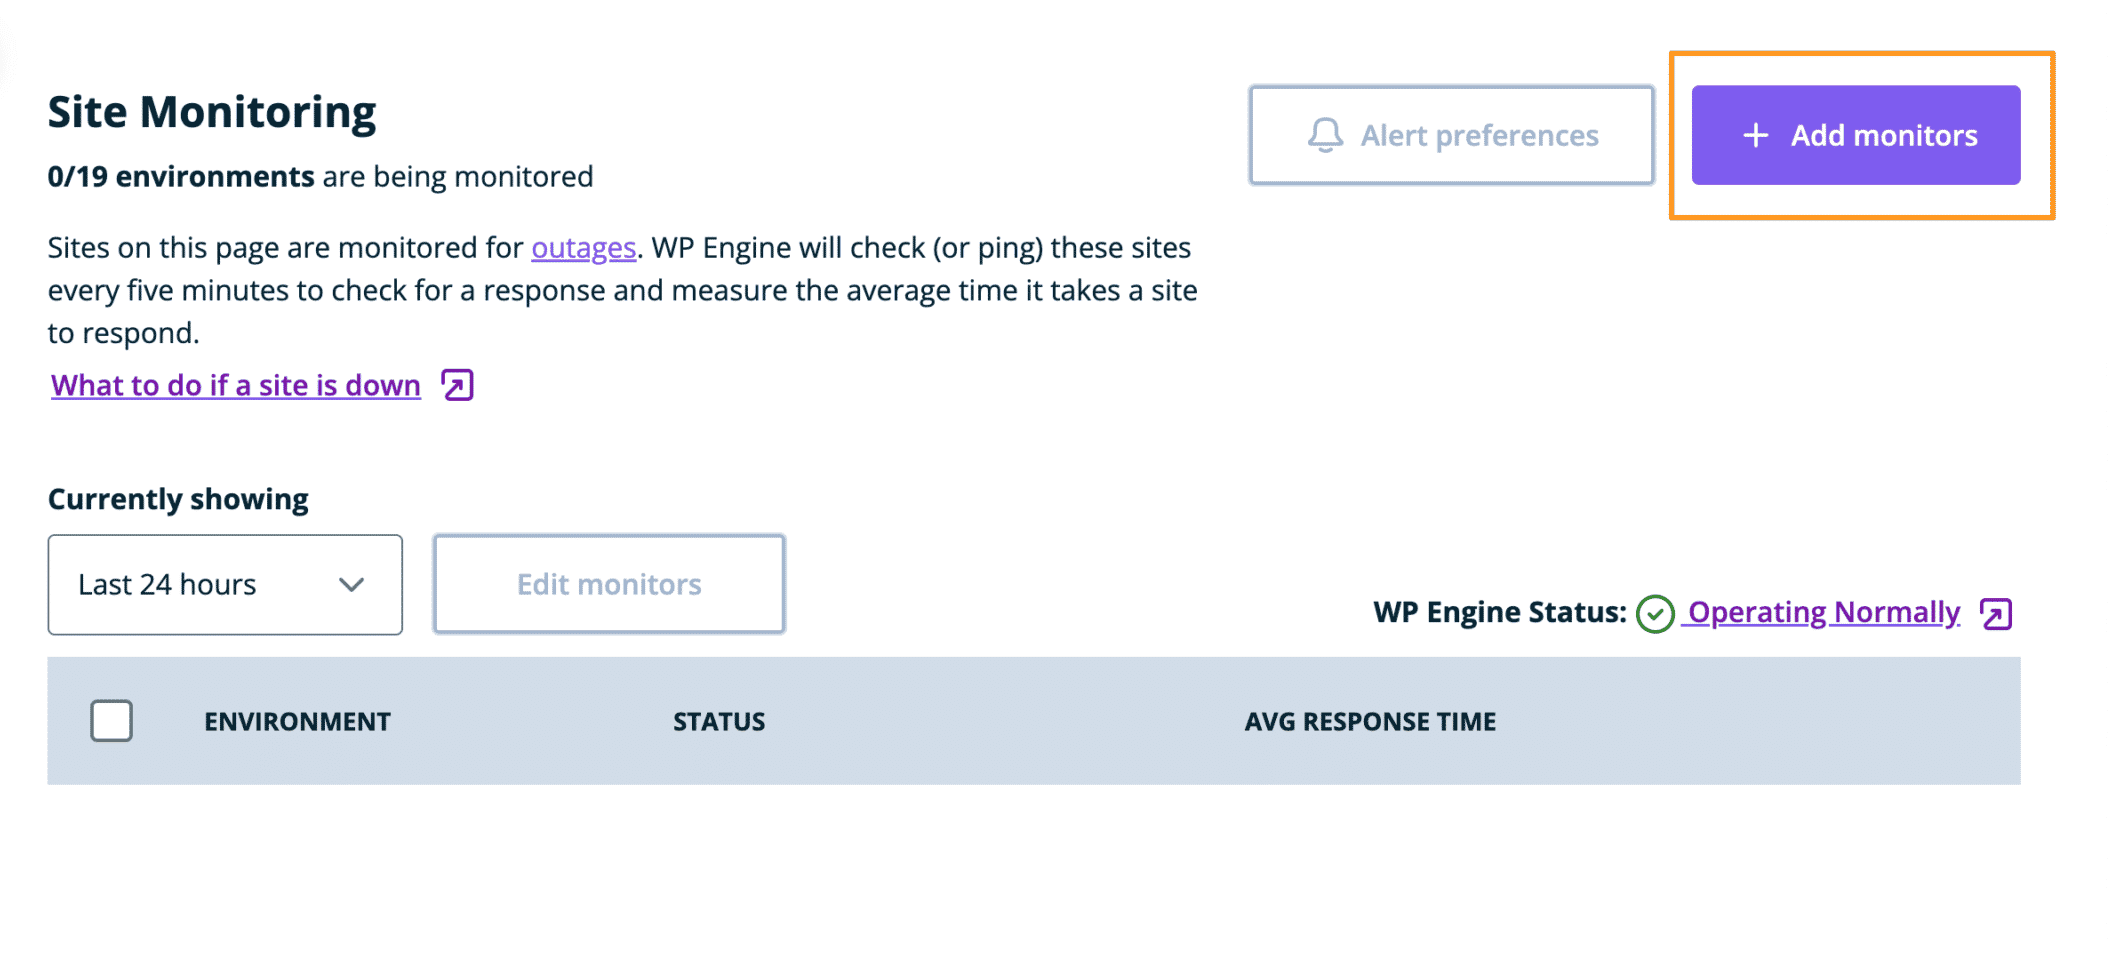
This page will have a variety of information available. The information in the table can be adjusted to display a specific time period by changing the time frame dropdown at the top of the columns.
Status
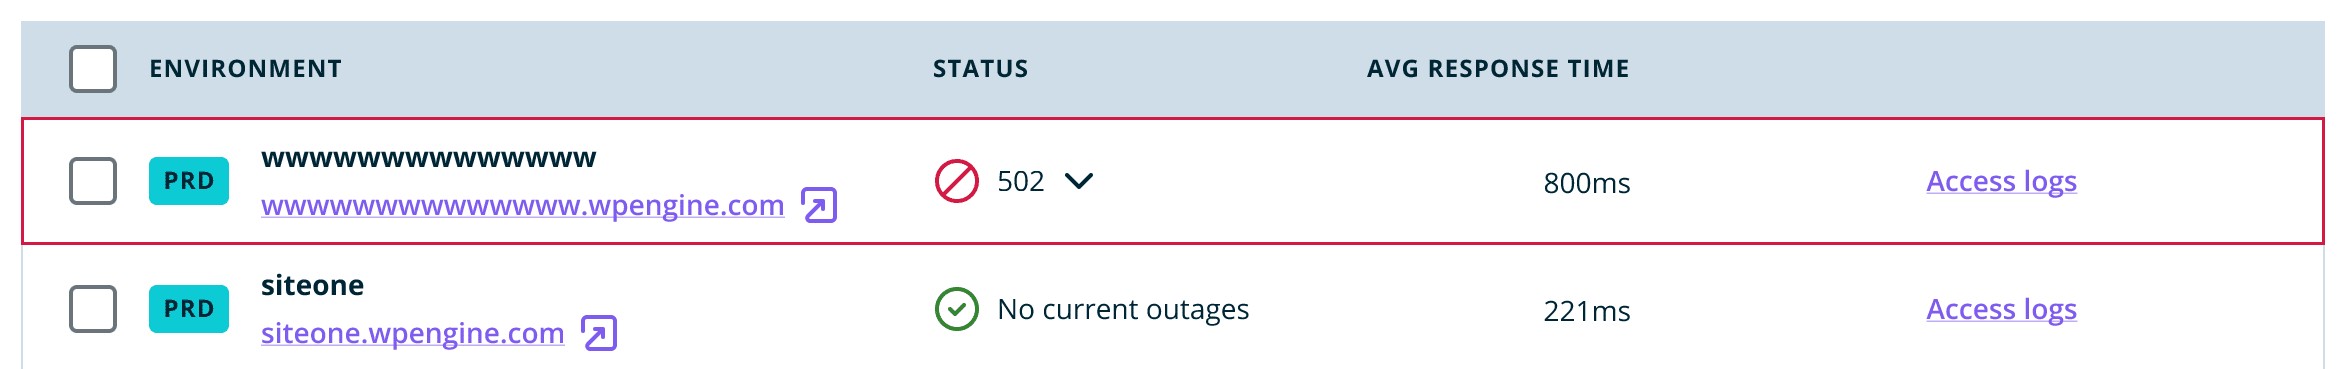
The Status column indicates the current uptime status of the environment.
- No current outages – A green checkmark with the status “No current outages” indicates the environment is available and no outages are detected.
- Outage detected – A red crossed-through circle indicates the site is experiencing an outage. The response code that Site Monitoring is detecting will display next to it.
- SPM is running – A grey clock icon with the status “SPM is running” indicates when Smart Plugin Manager is performing updates. This will display instead of a 503 error code that a maintenance page can sometimes display.
- SSL expired – Site Monitoring will now check for expired SSL certificates. Currently, the response code will display a 200 but with a warning symbol indicating an SSL warning.
Failed Checks
The failed checks column indicates the number of pings to your site that failed. Failed pings do not always indicate a site is down, but can indicate a less critical issue. Failed pings are measured against all pings to your site during the selected time period.
Response Time
The response time displayed for each environment is the average time it takes for your website to respond to our monitoring pings, measured in milliseconds (ms). The average is calculated over the time period selected in the dropdown located at the top of the columns.
Add Site Monitor
Site Monitoring can be purchased when you first sign up for a plan, any time from the User Portal, or by reaching out to your WP Engine Account Manager. Once you have acquired the product extension, you will then need to select and activate Site Monitoring for the desired environments.
- In the User Portal, select Products in the main sidebar menu
- Click Site Monitoring under Your products
- Found directly at: https://my.wpengine.com/products/site_monitors
- At the top, click Add Monitors
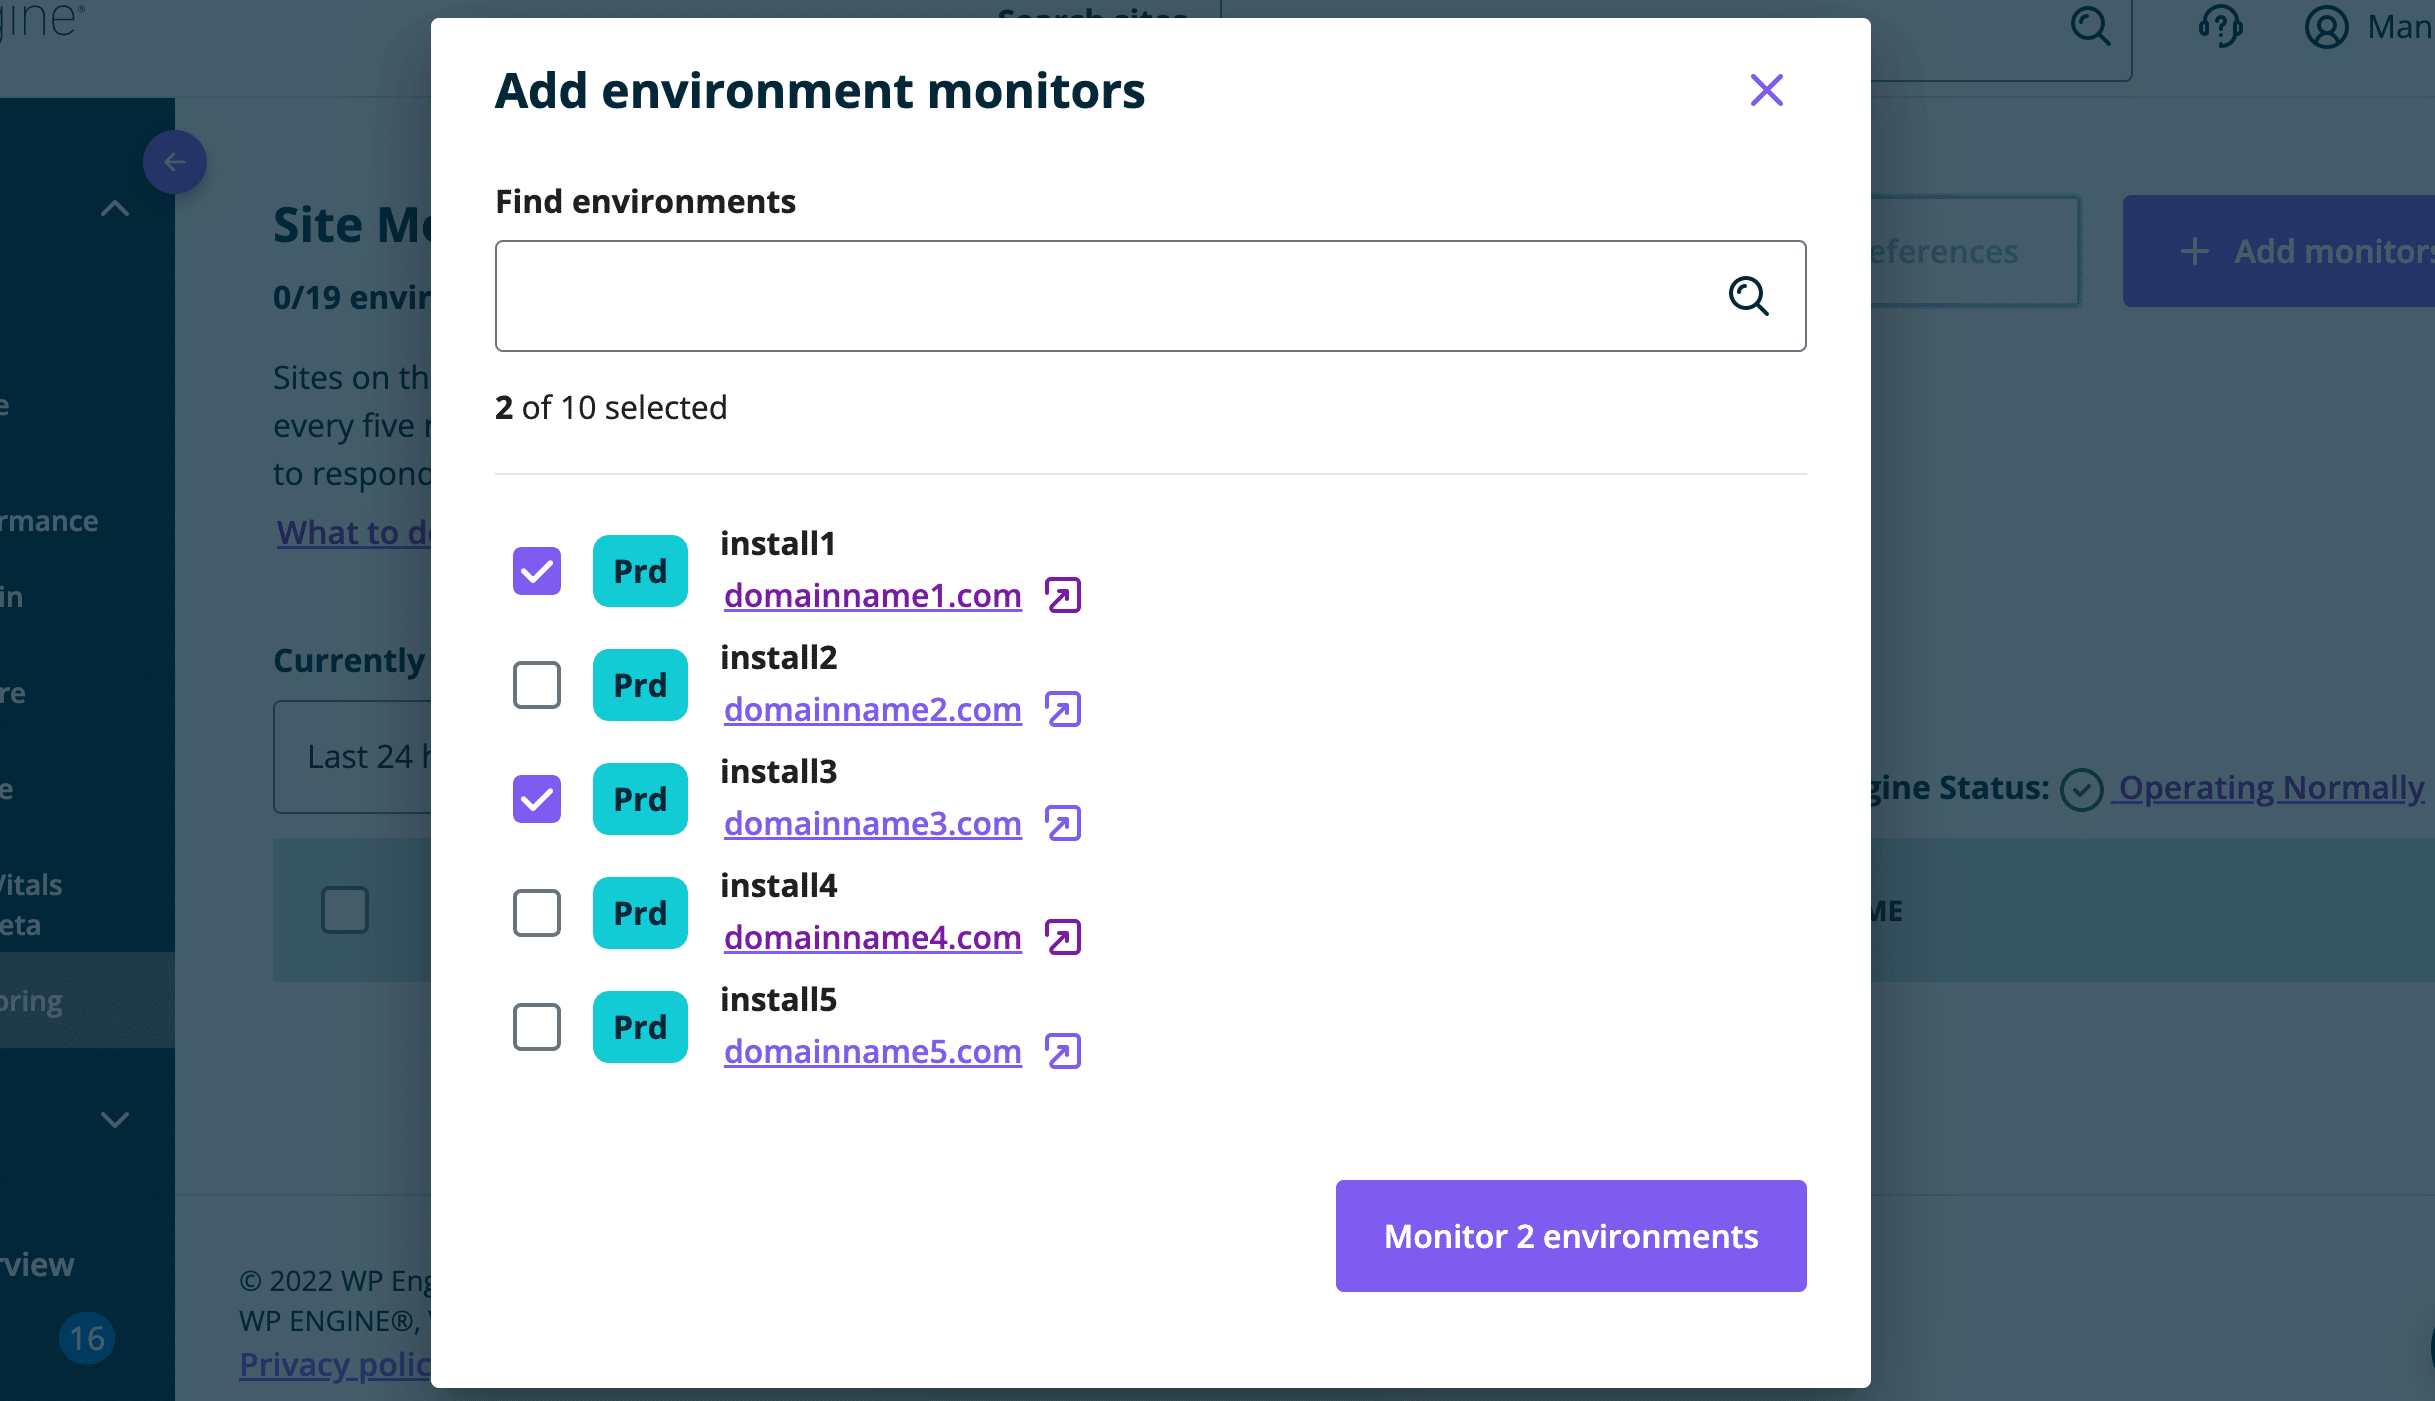
- Select the environment name(s) from the dropdown that you wish to monitor
- Only Production environments can be monitored
- Click Monitor Environment
Additional URL Monitoring
Once an environment has a primary monitor assigned, additional URLs can be monitored. The Primary domain must be monitored to monitor any additional URLs within the site. Each extra monitor will require an additional Site Monitoring license.
- From the WP Engine User Portal, click Products in the main sidebar menu
- Click Site Monitoring under Your products
- Found directly at: https://my.wpengine.com/products/site_monitors
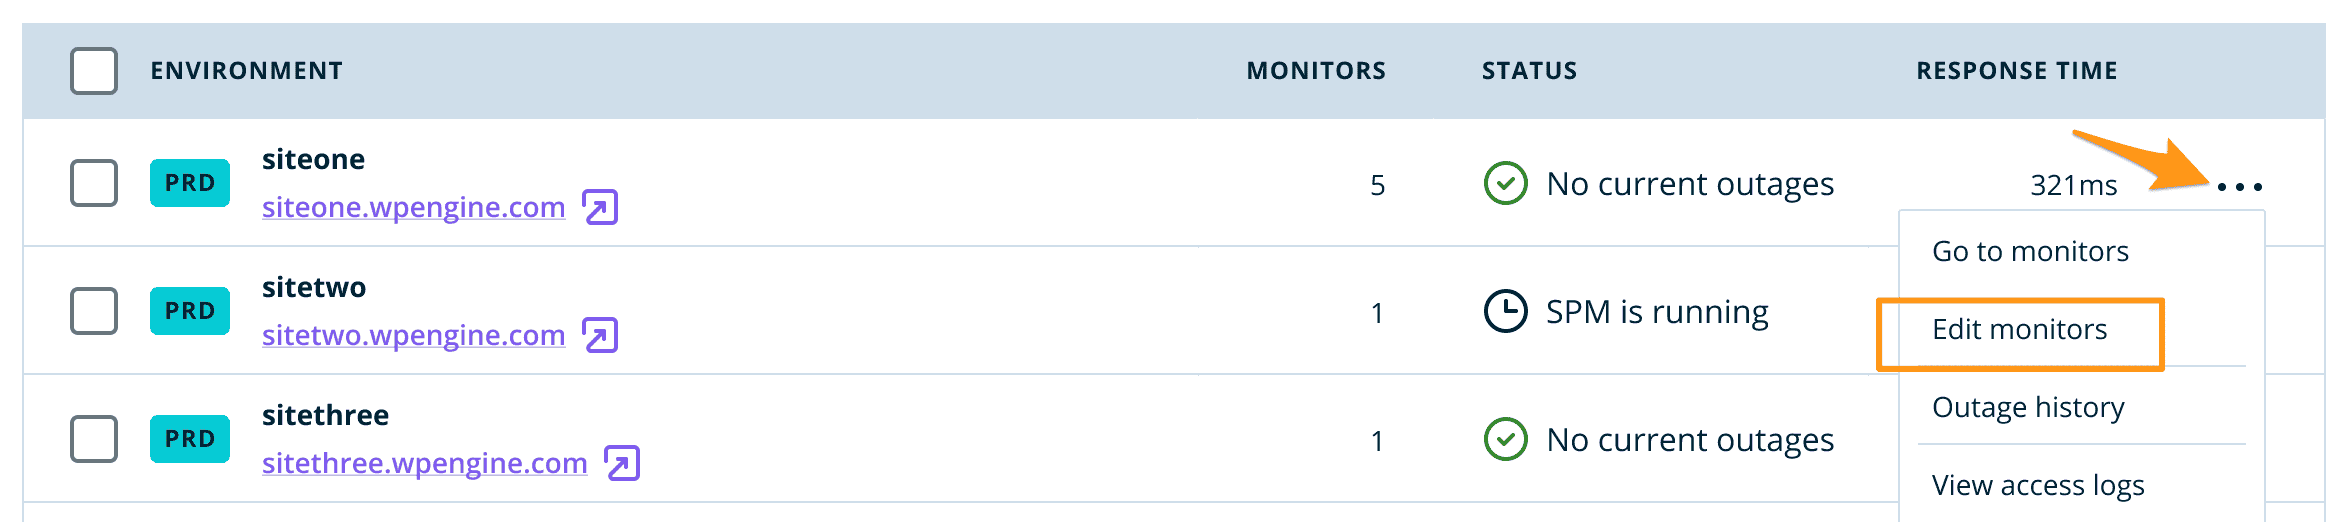
- Locate the environment where the URLs point
- Open the 3 dot action menu to the right
- Choose Edit monitors
- Select any domains on the environment that you wish to monitor
- Click Save
At this point the domain is monitored. To monitor additional URLs within a domain, including subdomains and subdirectories, continue with the steps below.
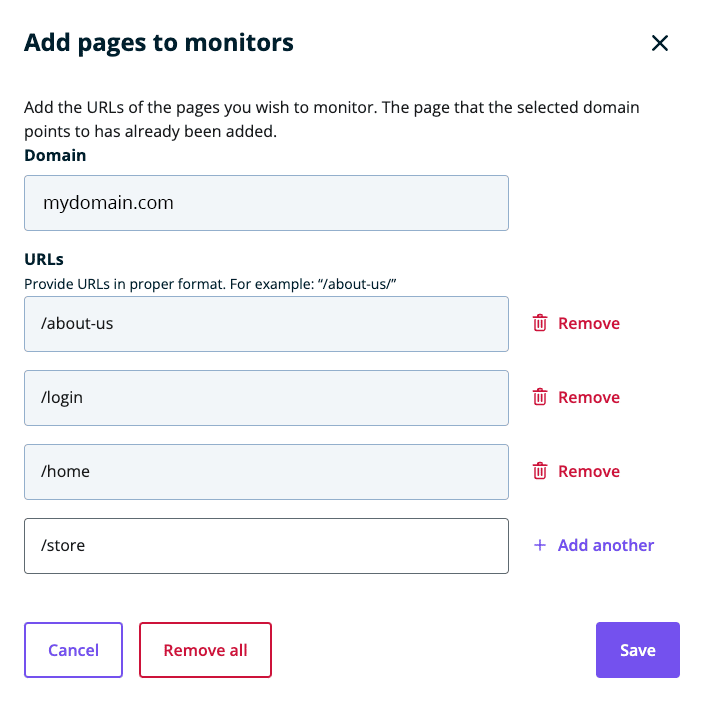
- To monitor additional URLs within a domain, click Add Pages next to the domain
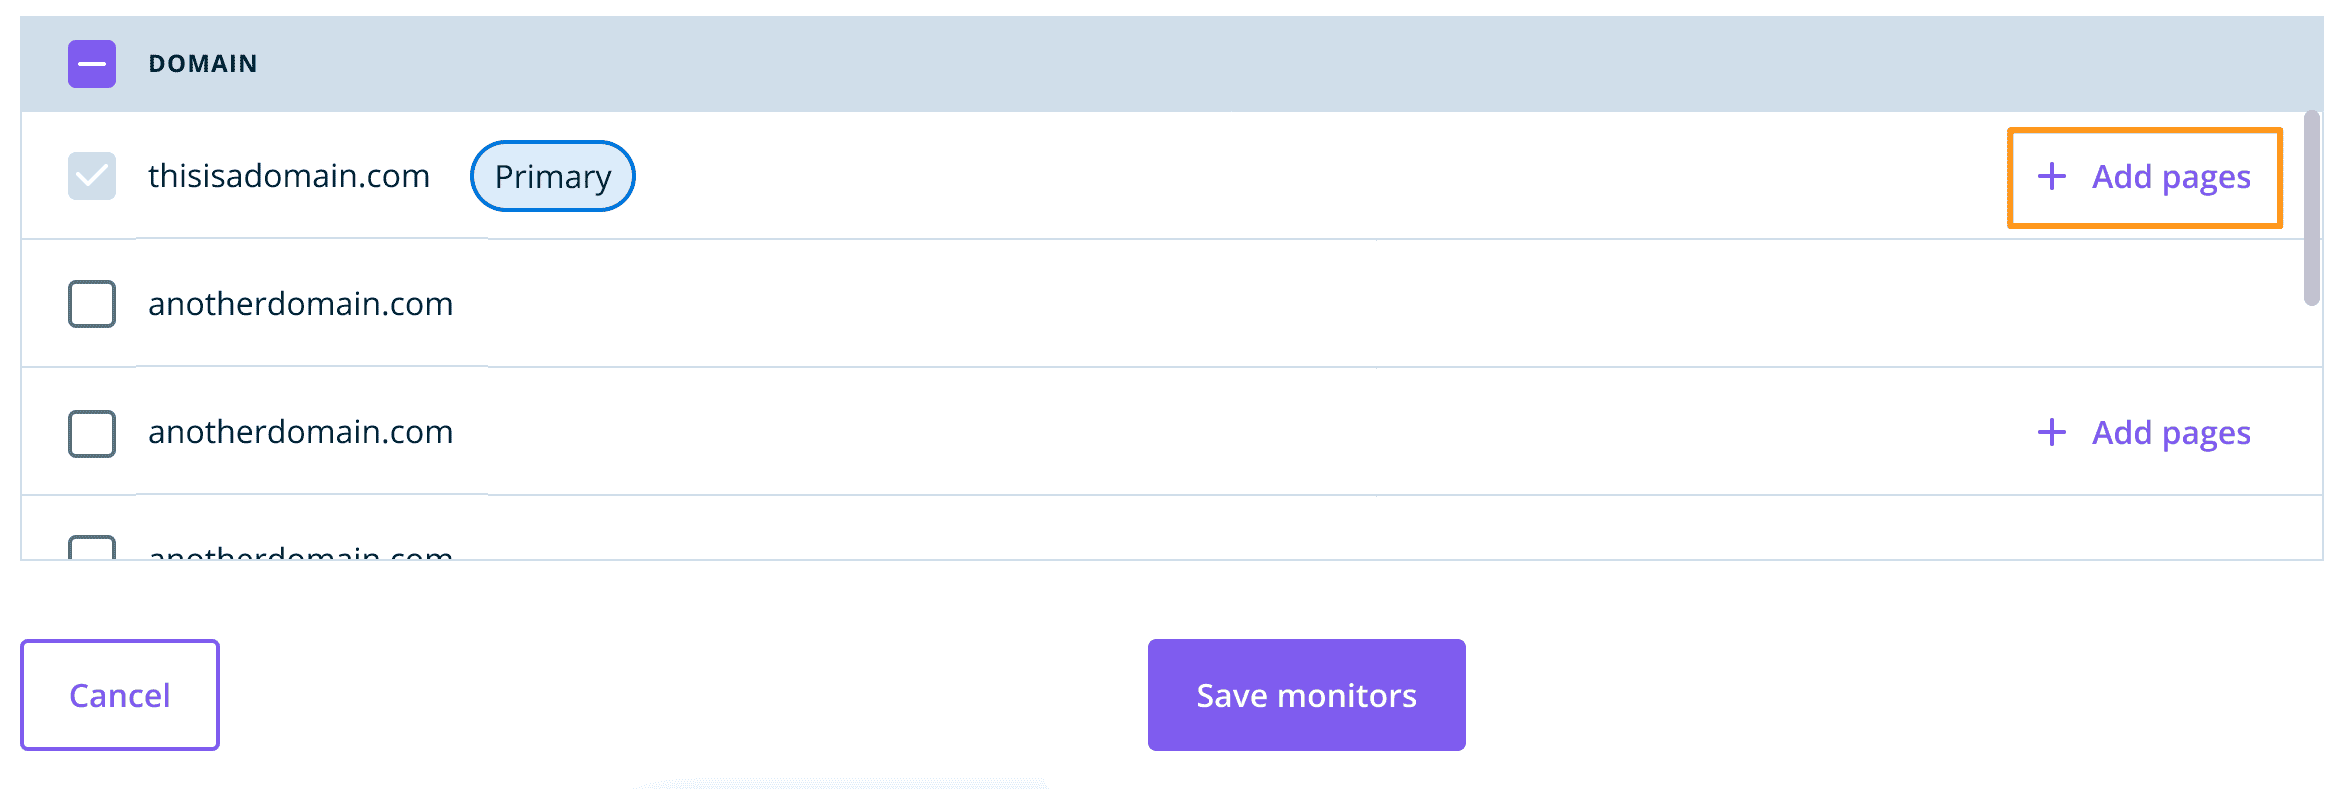
- Input the URL to monitor then Save any changes
Alert Preferences
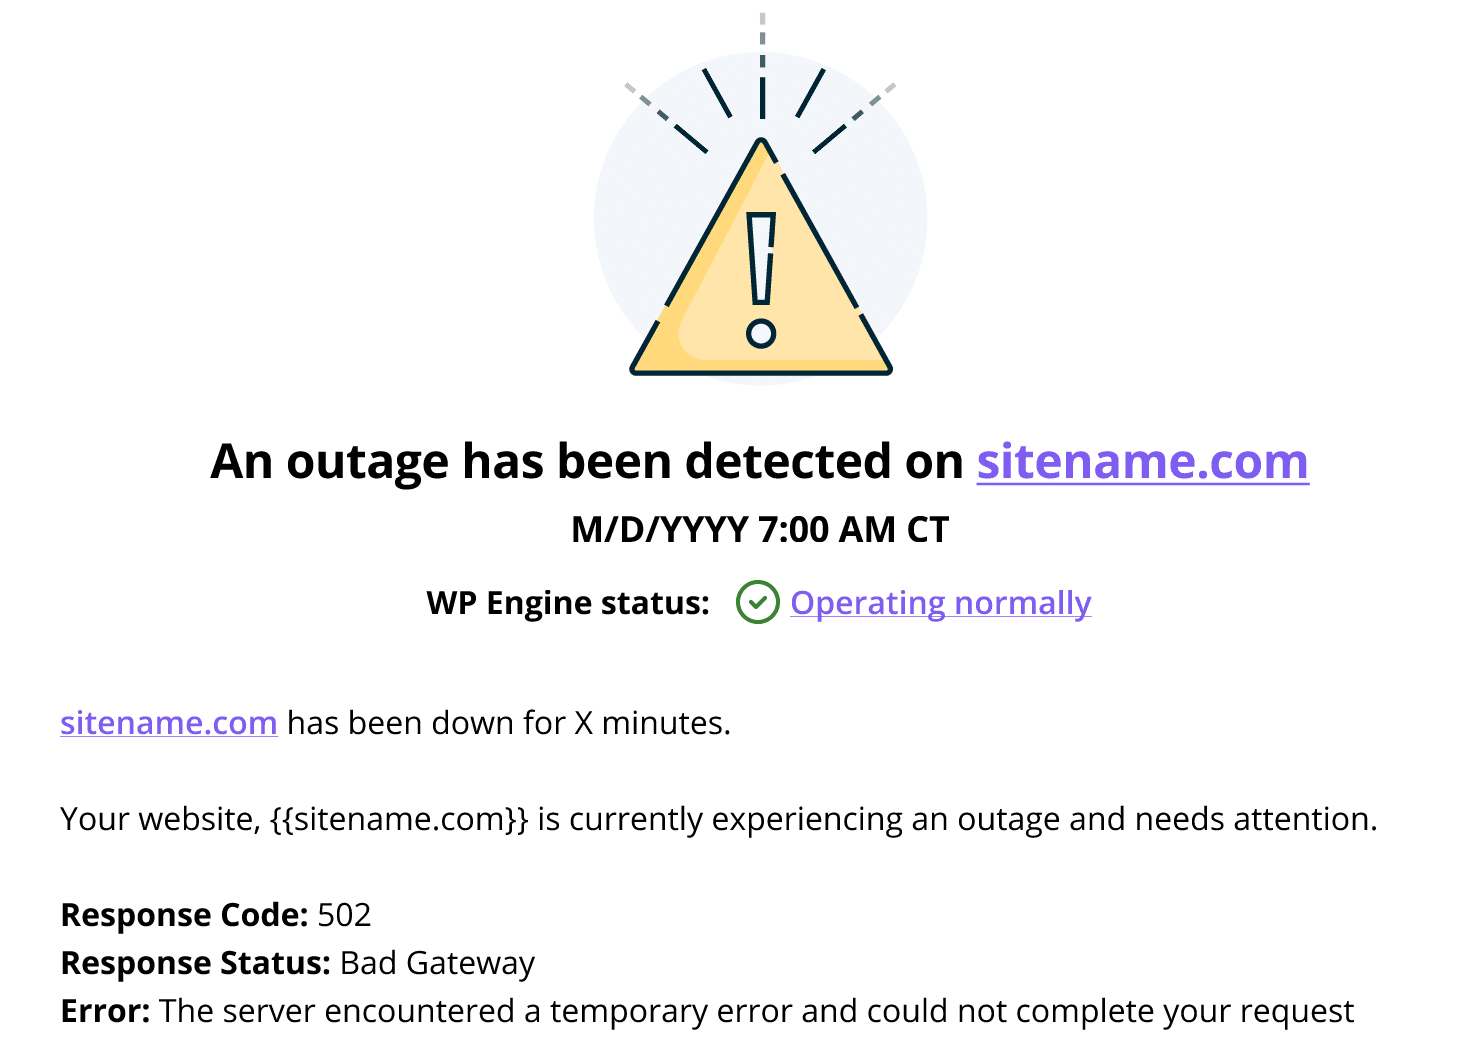
The Site Monitoring product allows for the configuration of alert notifications. If an outage is detected, this alert will supply the environment name, error or response code, and WP Engine’s current platform status to help you quickly diagnose the issue.
Alert notifications are sent when there is an outage, and sent again when there is no longer an outage detected. You will not continuously receive alerts during a failure.
Additionally, users that are selected to receive alerts will receive them for all environments that report an outage. Technical Contacts will receive outage alerts via email by default, and can configure preferences as shown below.
Notifications can be sent to account owners and full users assigned to the monitored environments, as well as custom email addresses not directly associated with the environments. All users selected will receive alerts for all monitored environments.
To receive Site Monitoring alert notifications via email:
- In the WP Engine User Portal, click on the bell icon in the top right corner and select the gear icon to access the Notification Center Settings
- Found directly at: https://my.wpengine.com/notifications/settings
- Expand the Email section
- Click on Create policy

- Select one or multiple users to receive alerts

- Click Next
- Select the alerts you want to receive from the Site Monitoring section
- Click Create Policy

To disable email alerts, simply click Remove on the messages you no longer wish to receive.
Slack
Slack notifications can be configured for Site Monitoring outage alerts. These alerts can be sent to a specified Slack channel or several channels for your team. Alerts will be sent for all monitored sites and cannot yet be configured on a site-by-site basis.
- In the WP Engine User Portal, click on the bell icon in the top right corner and select the gear icon to access the Notification Center Settings
- Found directly at: https://my.wpengine.com/notifications/settings
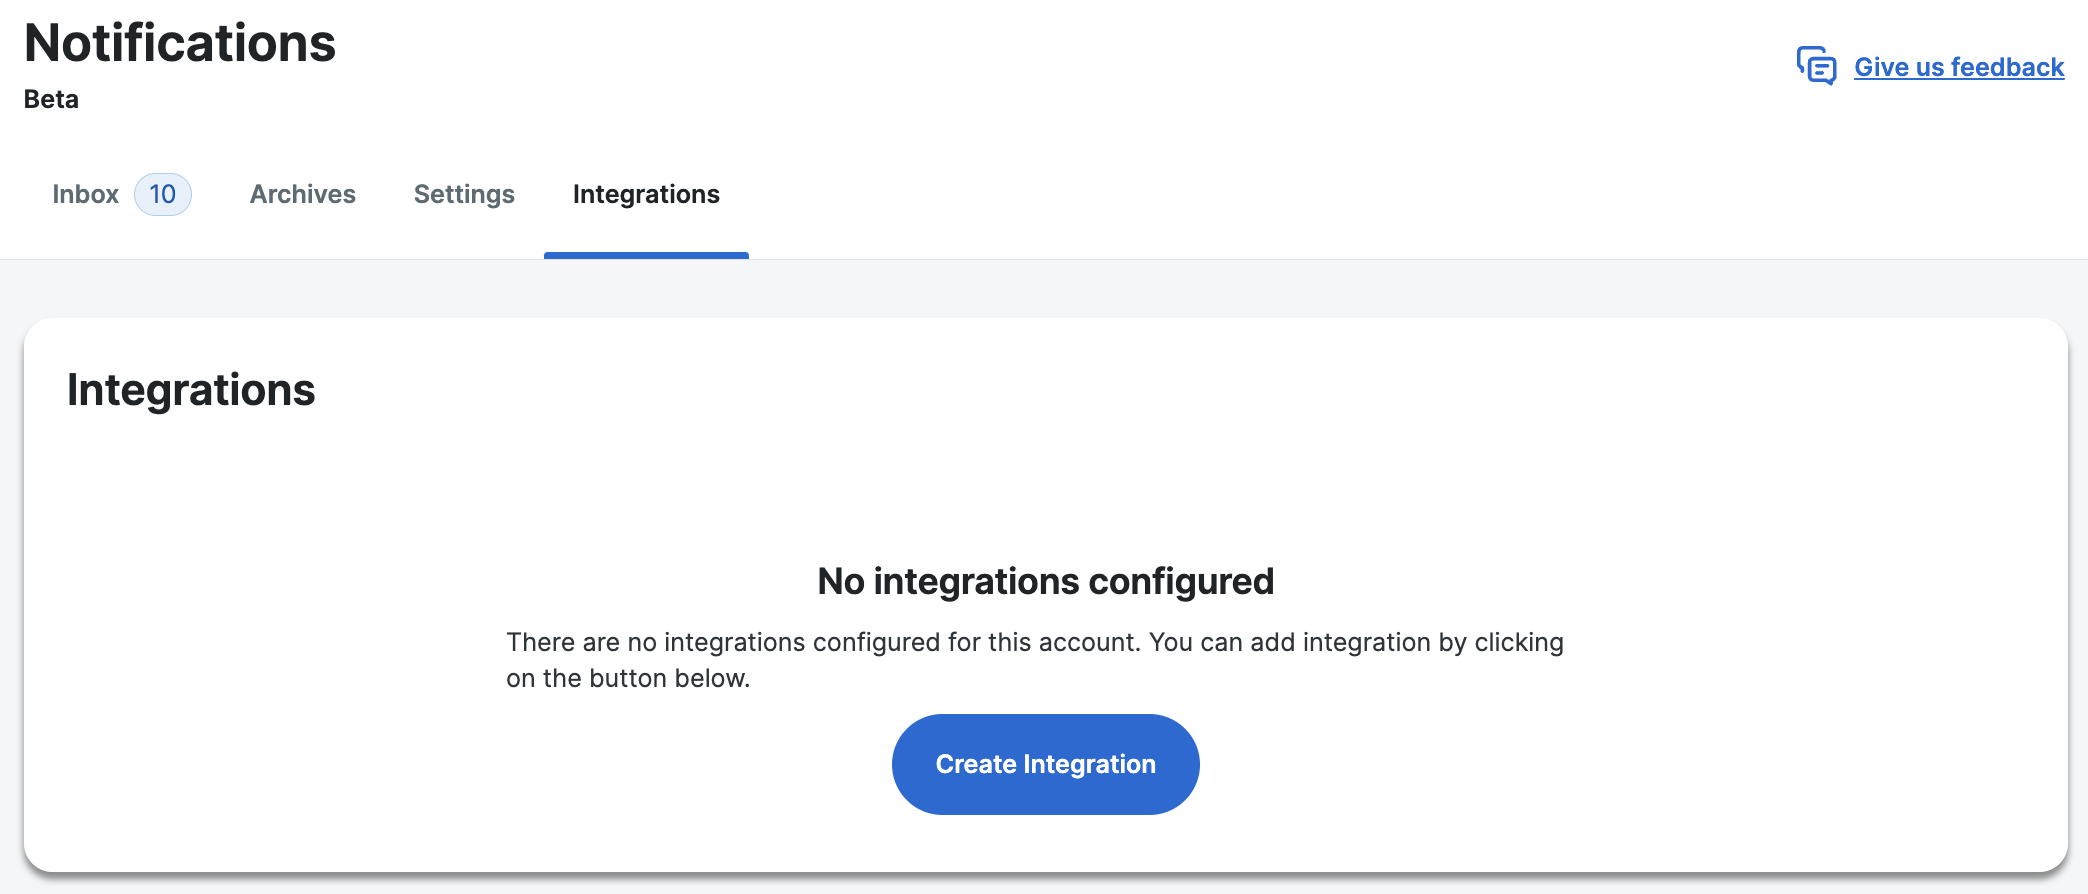
Integrate Slack
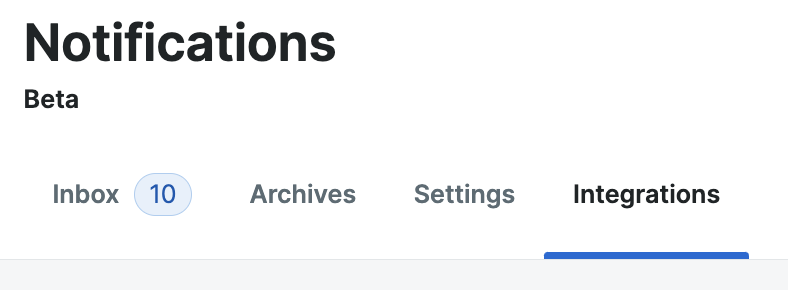
- Click the Integrations tab to connect your Slack workspace
- Slack integrations only need to be configured once. If you’ve previously integrated your Slack workspace with the Notification Center, you may skip this step and go directly to Set up Slack notifications
- Click Create Integration, and select Add to Slack
- You will see a pop-up with an official Slack page where you must grant the WP Engine app permissions to your workspace. Click Allow.
- Once confirmed you will be redirected back to the WP Engine User Portal page
- Multiple different Slack workspaces can be integrated here
Set up Slack notifications
- Click the Settings tab at the top of the page to finish setting up the Slack notifications you wish to receive
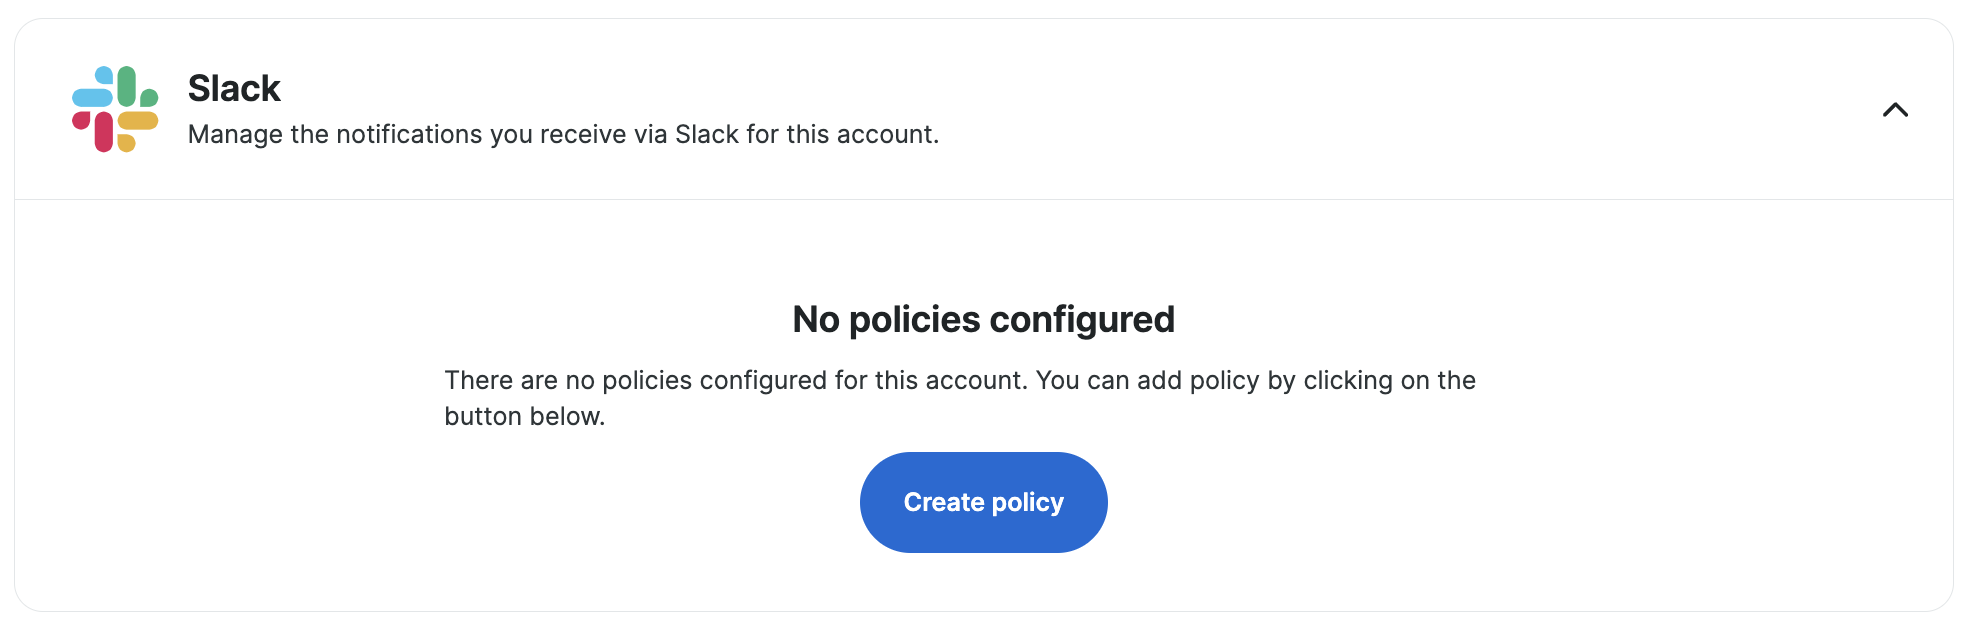
- Expand the Slack section and click Create policy
- Choose the Slack workspace to use
- Select the channels to receive a notification when an outage occurs
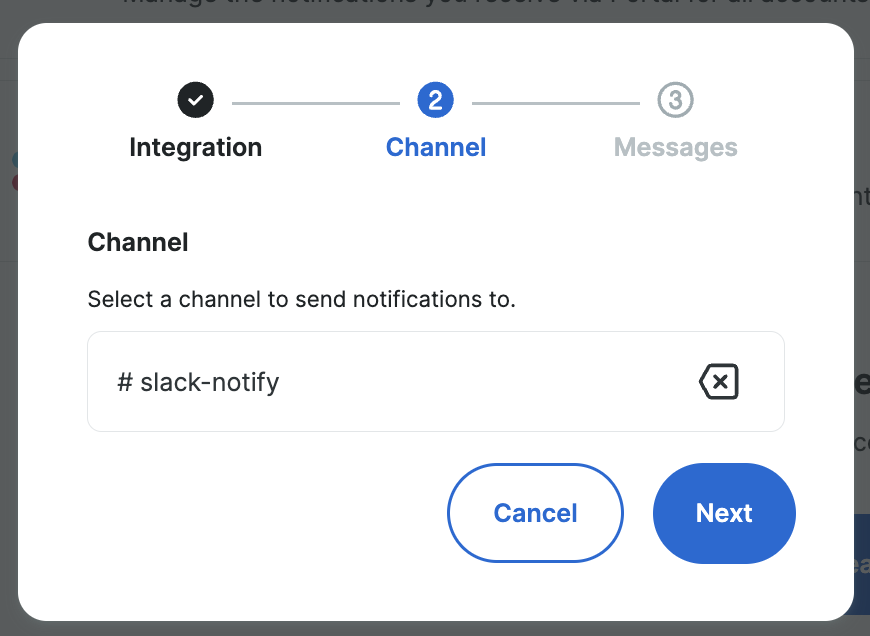
The integration will not post to Slack channels that have restricted access. If you remove a Slack channel in the Slack app, it will also remove it from this dropdown list.
- Select the alerts you want to receive from the Site Monitoring section and click Create Policy
To deactivate the WP Engine Slack integration at any time, simply click Remove on the messages you no longer want to receive.
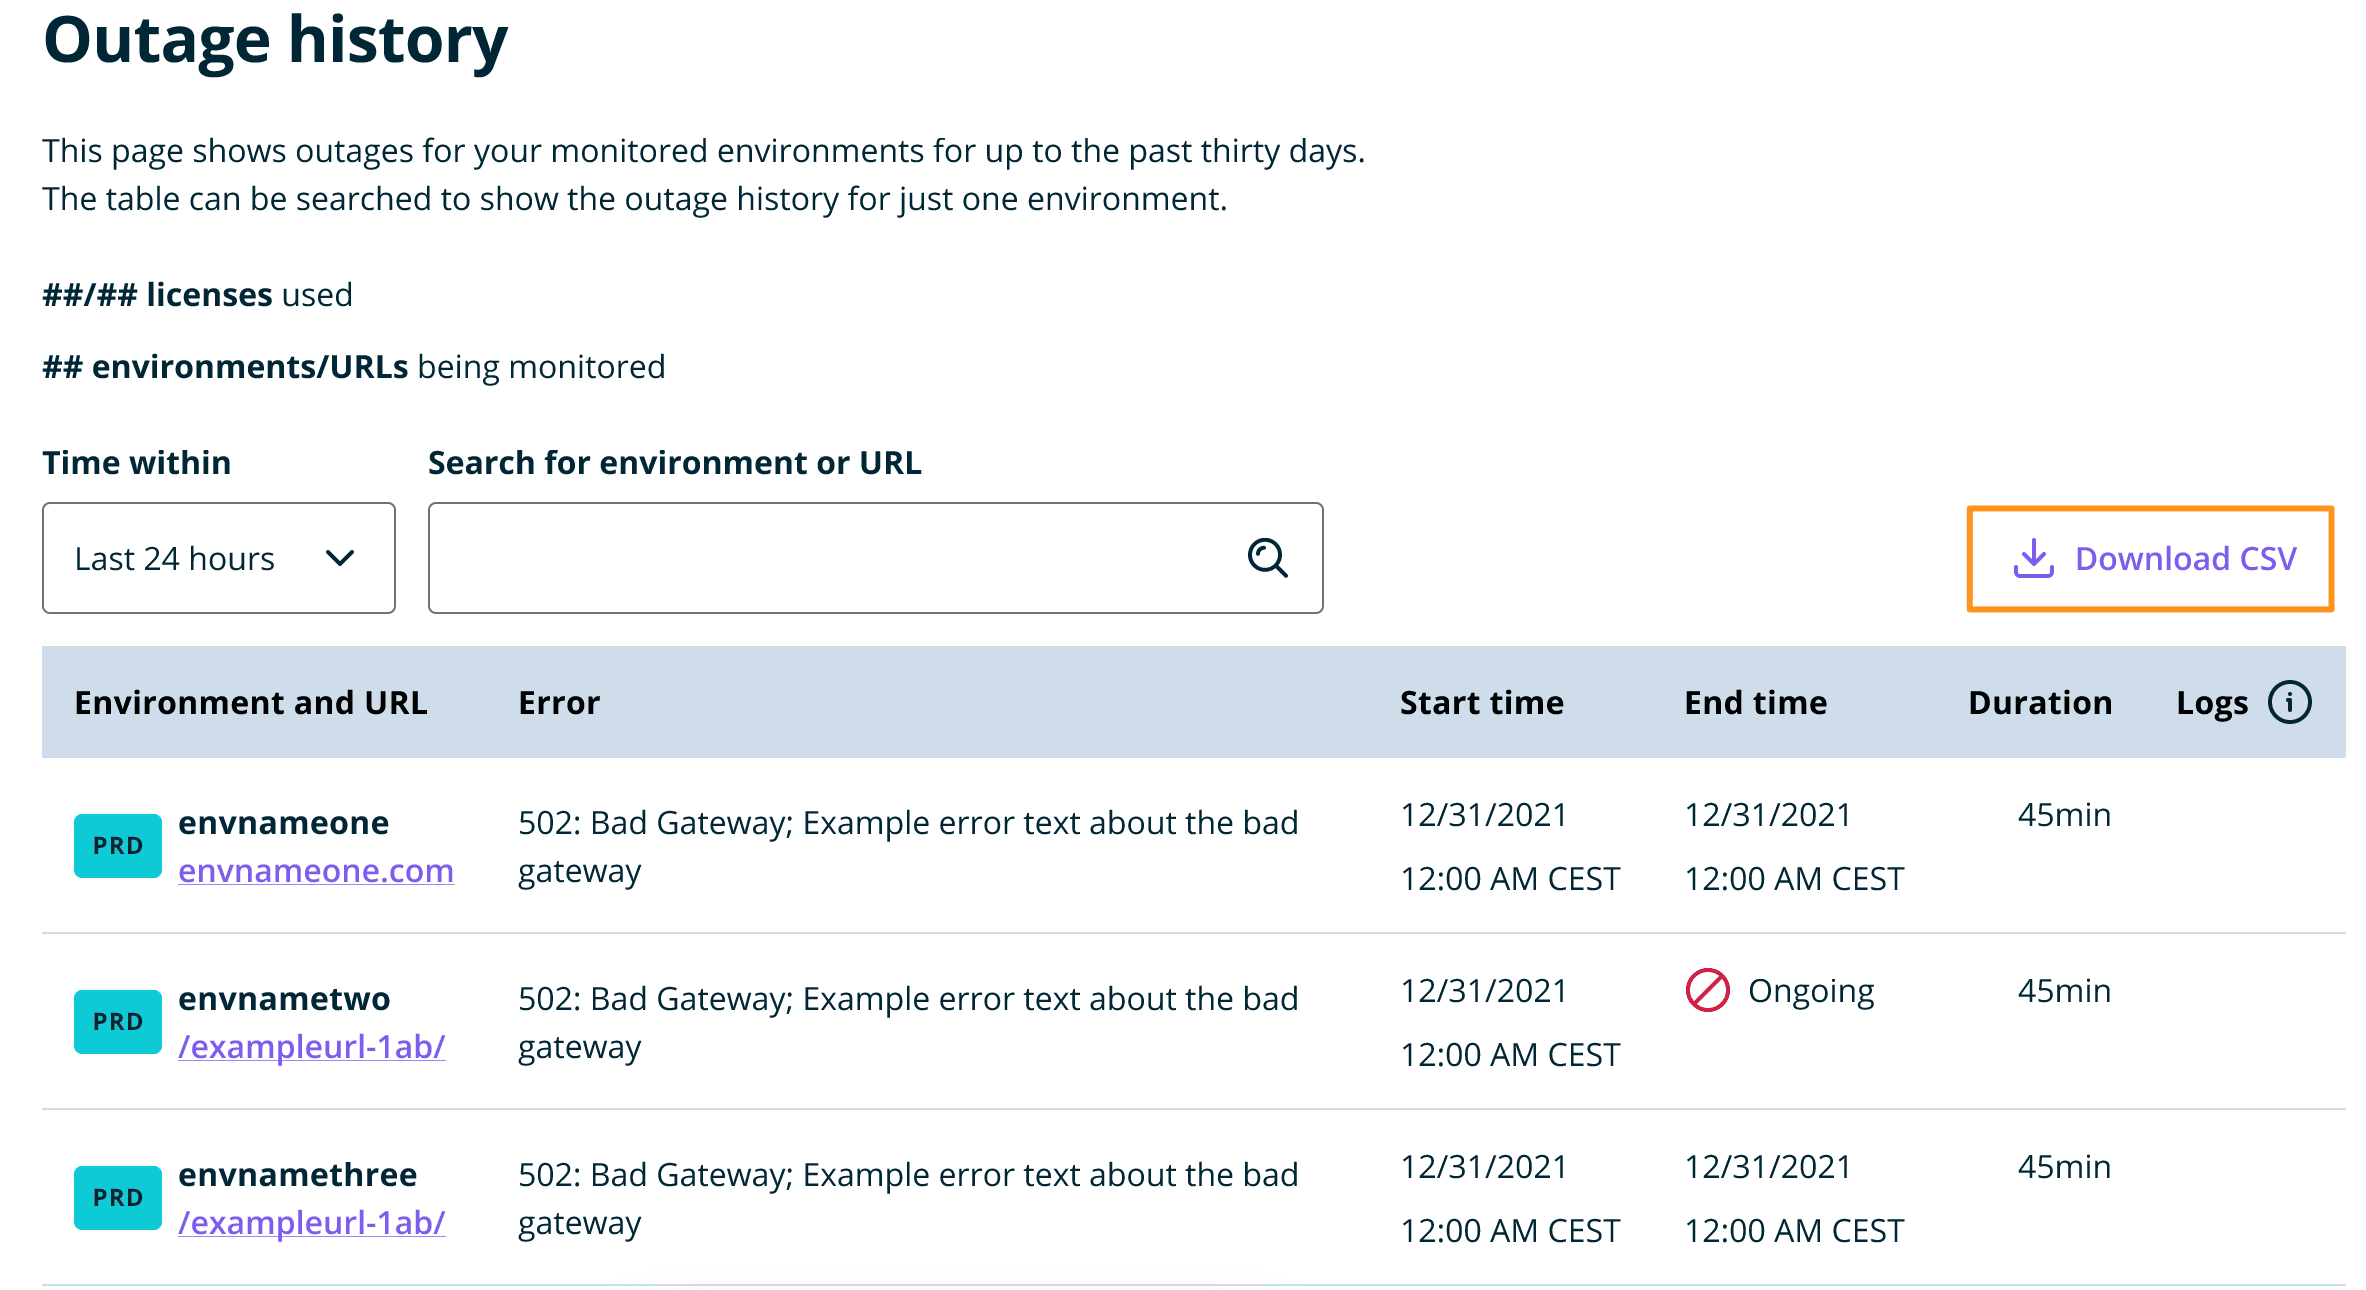
Outage History
A full history of outages can be viewed by selecting the Outage History button.

The history of outages ranging from 30 minutes to 30 days will be displayed. These can be filtered by time frame or sorted by URL.
Additionally, the outage history for your monitored sites can be exported by clicking Download CSV.
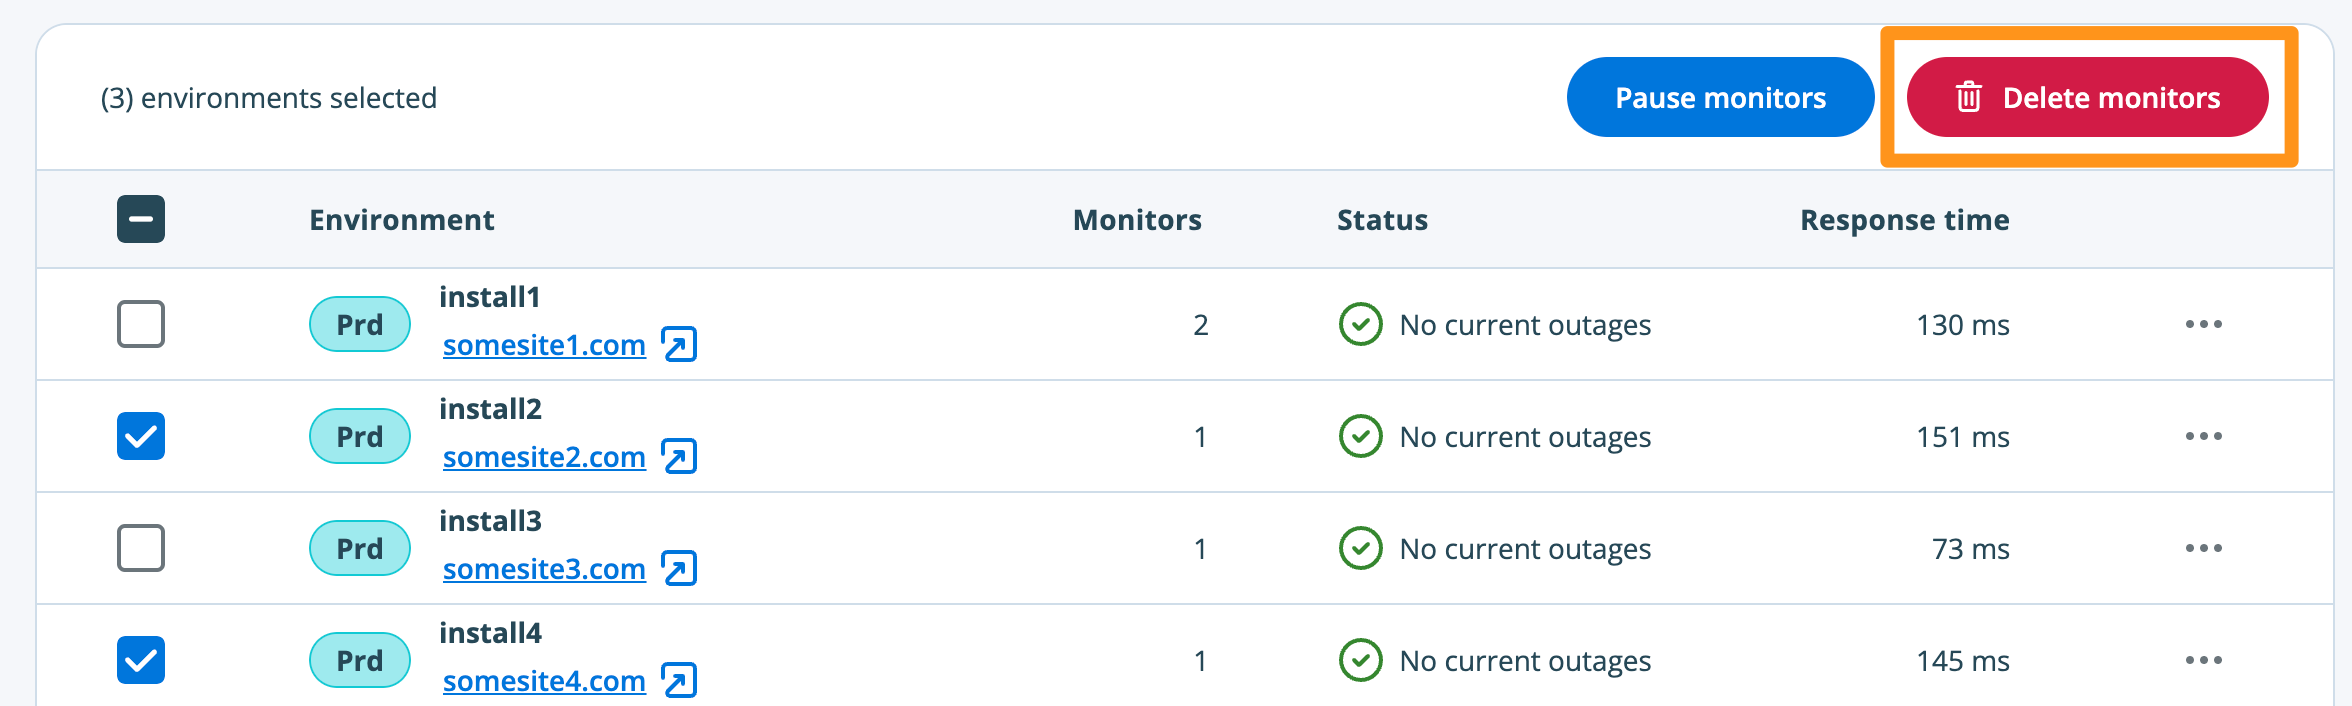
Remove Monitor
Site Monitors can be removed by entire environment or individual URLs from the Site Monitoring management page.
To remove all Site Monitors from an environment, select the environment(s) then click Delete monitor.
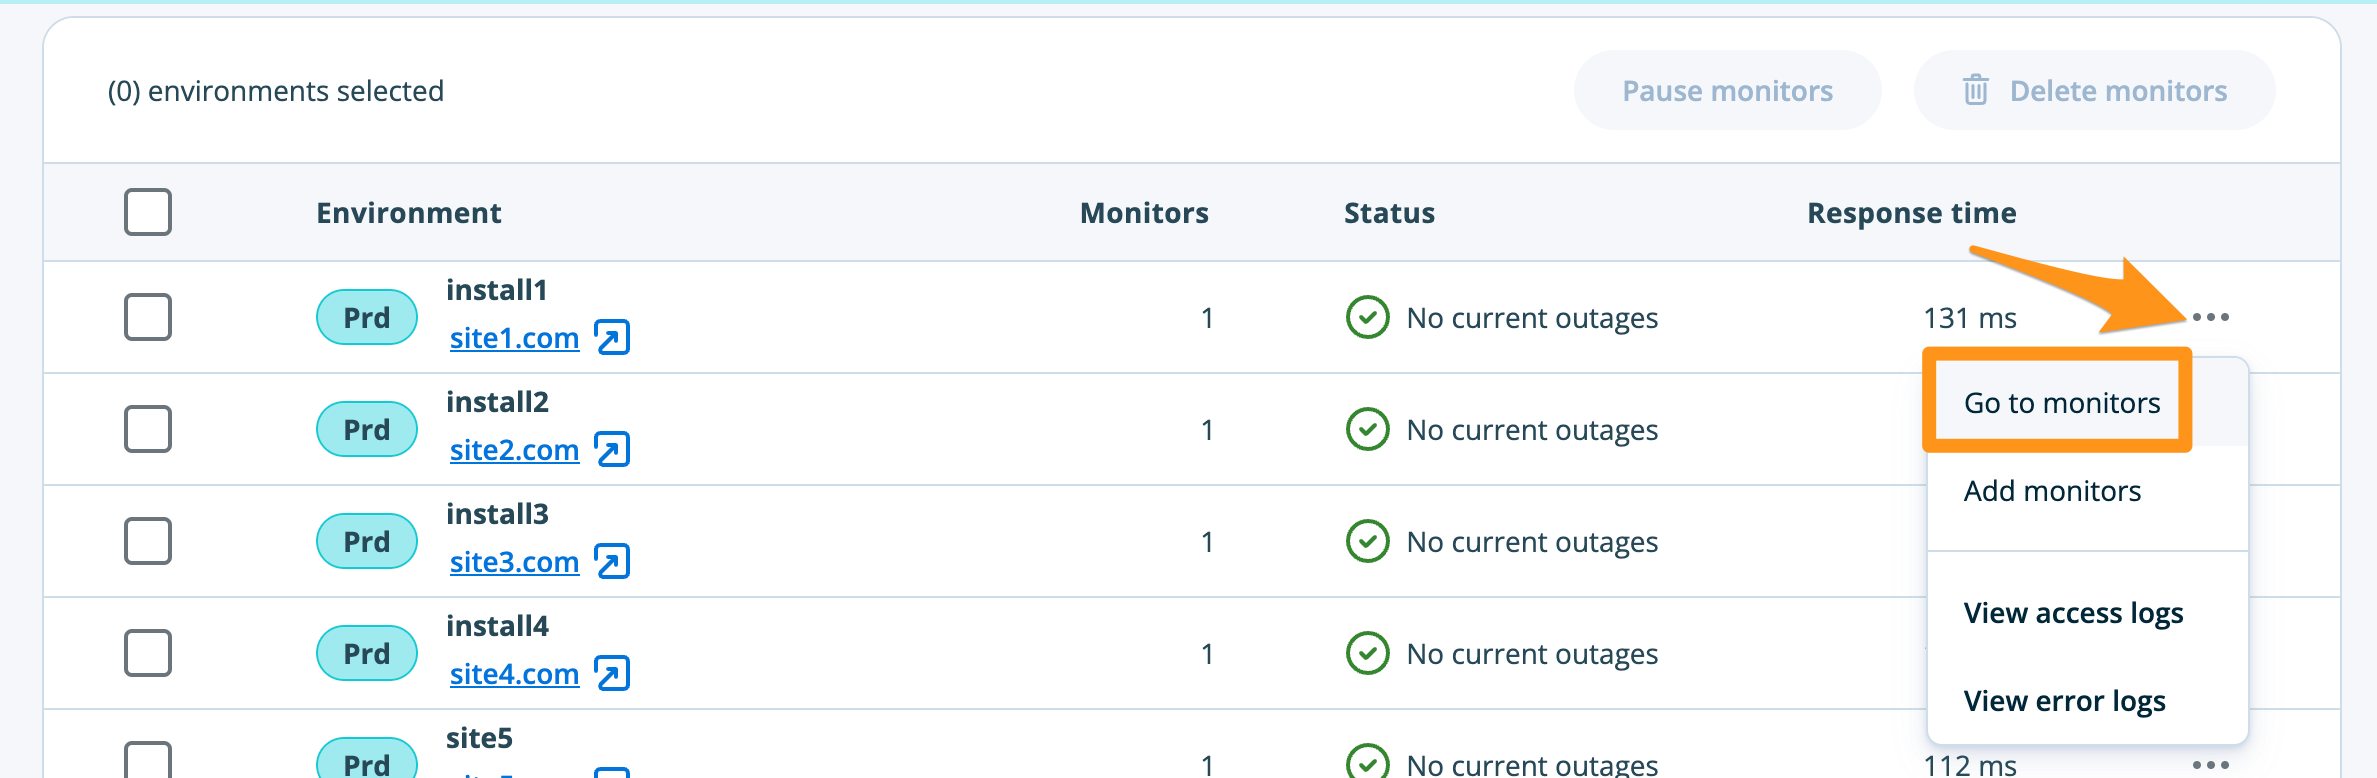
To delete a Site Monitor from a specific URL, locate the environment the URL belongs to and expand the three dot “more actions” menu to the right, then select Go to monitors. Finally, select the URL(s) and click Delete monitor.
Site Monitoring and APM
Site Monitoring is a standalone product and therefore does not require New Relic or Application Performance Monitoring (APM). However, Site Monitoring and APM can be used at the same time and will complement one another.
Site Monitoring provides alerts when your website has an issue, such as a 404. While APM provides more granular code-level information and can have custom alerts configured.
Limitations
There are currently some situations where the Site Monitoring service is not yet supported:
- Multisite is supported, however be aware that Site Monitoring licenses are applied to URLs individually. Multiple licenses will be necessary to monitor each domain, subdomain, or subdirectory.
- If the option is not visible, try enabling our API on your account from the API Access page.
Read more about the WP Engine API here.
- If the option is not visible, try enabling our API on your account from the API Access page.
- Password-protected sites (either through WP Engine or a third-party) are not supported.
- WP Engine Headless Platform accounts are not supported.
- Email and Slack alerts are the only available notification types. (Additional notification channels will be available in the future.)
- Site Monitoring will only take place on Production environments.
- Only the Primary domain will be tested. Learn more about the Primary domain here.
- Site Monitoring identifies site-level issues only. i.e. 404, 500 etc
- When migrating a site to a different WP Engine account, Site Monitoring should be disabled prior to initiating the reparenting process. Failure to delete Site Monitoring from a site before the transfer will result in the inability to create a new monitor on the receiving account.
NEXT STEP: Learn about WP Engine server monitoring